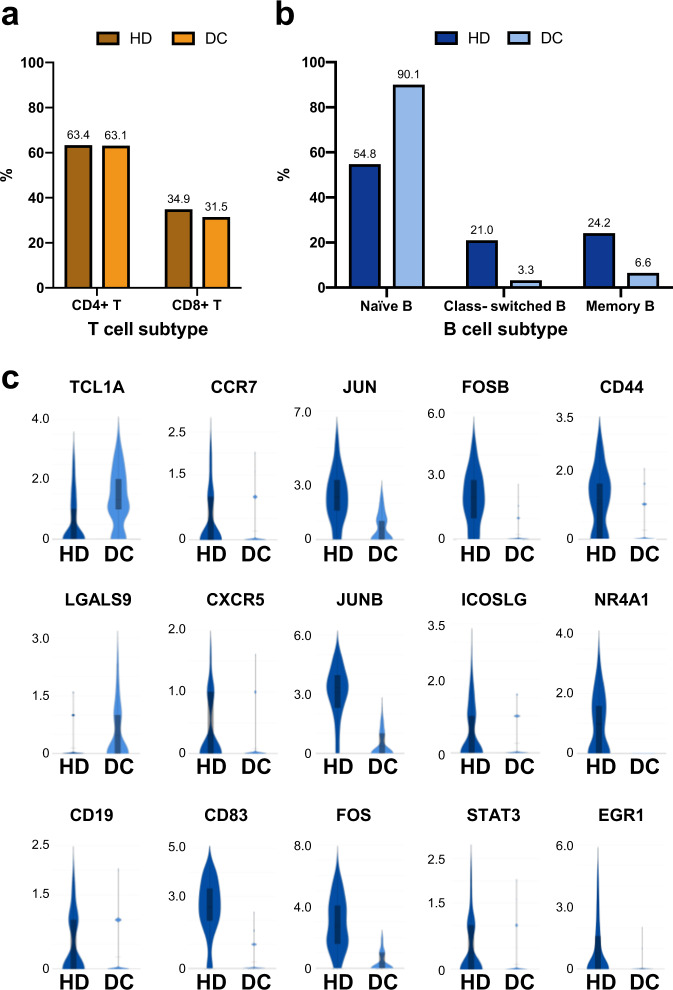
Fig. 4. The DC patient exhibits defects in B-cell function.
a Bar graph showing CD4+ T and CD8+ T-cell proportions in the healthy donor and DC patient. b Bar graph showing distinct B-cell subset proportions in the healthy donor and DC patient. c Violin plots showing the differential expression levels of B-cell marker genes in B cells between the healthy donor and DC patient. The box represents the interquartile range; The whiskers represent the rest of the distribution.

