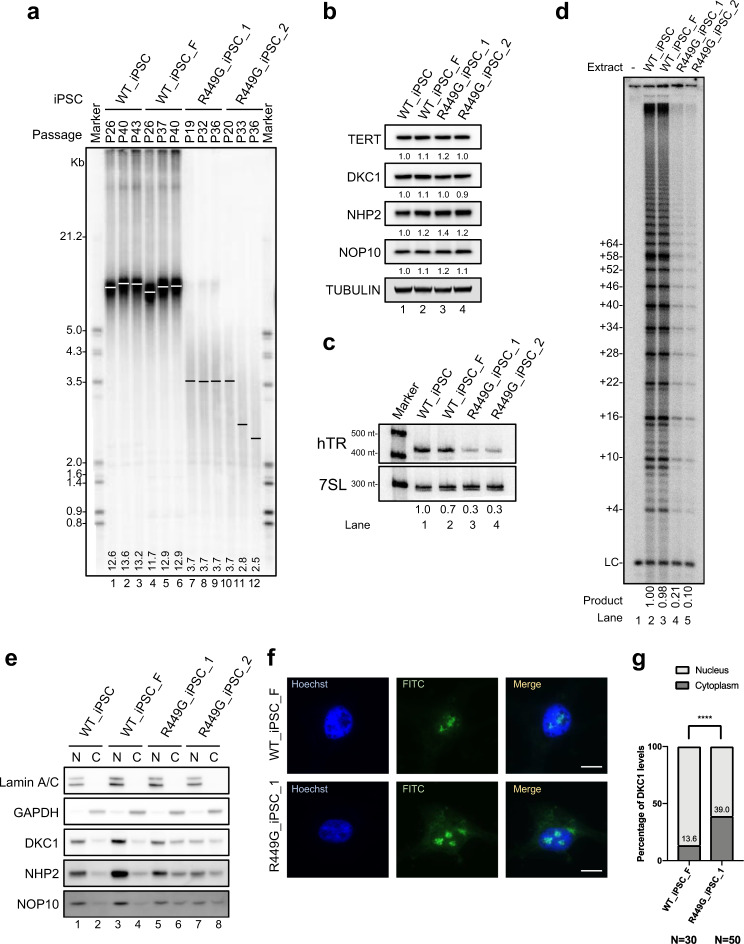
Fig. 5. DKC1_R449G iPSCs exhibit a shorter telomere length, decreased levels of hTR, reduced telomerase activity, and mislocalized DKC1.
a Telomere lengths determined by TRF analysis of gDNA prepared from WT_iPSC, WT_iPSC_F, R449G_iPSC_1 and R449G_iPSC_2 cells. b Western blot analysis of cell lysates from WT_iPSC, WT_iPSC_F, R449G_iPSC_1 and R449G_iPSC_2 cells. TUBULIN served as a loading control. c Northern blot analysis of hTR from WT_iPSC, WT_iPSC_F, R449G_iPSC_1 and R449G_iPSC_2 cells. A probe against 7SL RNA served as a loading control. d Direct telomerase activity assay of cell lysates from WT_iPSC, WT_iPSC_F, R449G_iPSC_1 and R449G_iPSC_2 cells. 18-nucleotide telomeric primers (TTAGGG)3 were used. A 32P end-labeled 18-nucleotide telomeric primers (TTAGGG)3 was added as loading control (LC). The numbers on the left (+4, +10, +16, +22, +28, etc.) indicate the number of nucleotides added to the telomeric-primer for each major band seen. e Western blot analysis of nuclear and cytosolic fractions from WT_iPSC, WT_iPSC_F, R449G_iPSC_1 and R449G_iPSC_2 cells. Lamin A/C served as a nuclear marker, and GAPDH served as a cytosolic marker. f Immunofluorescence of DKC1 in WT_iPSC_F and R449G_iPSC_1 cells. The scale bar represents 10 µm. g Bar graph illustrating the distribution of DKC1 in the cytosolic and nuclear fractions.

