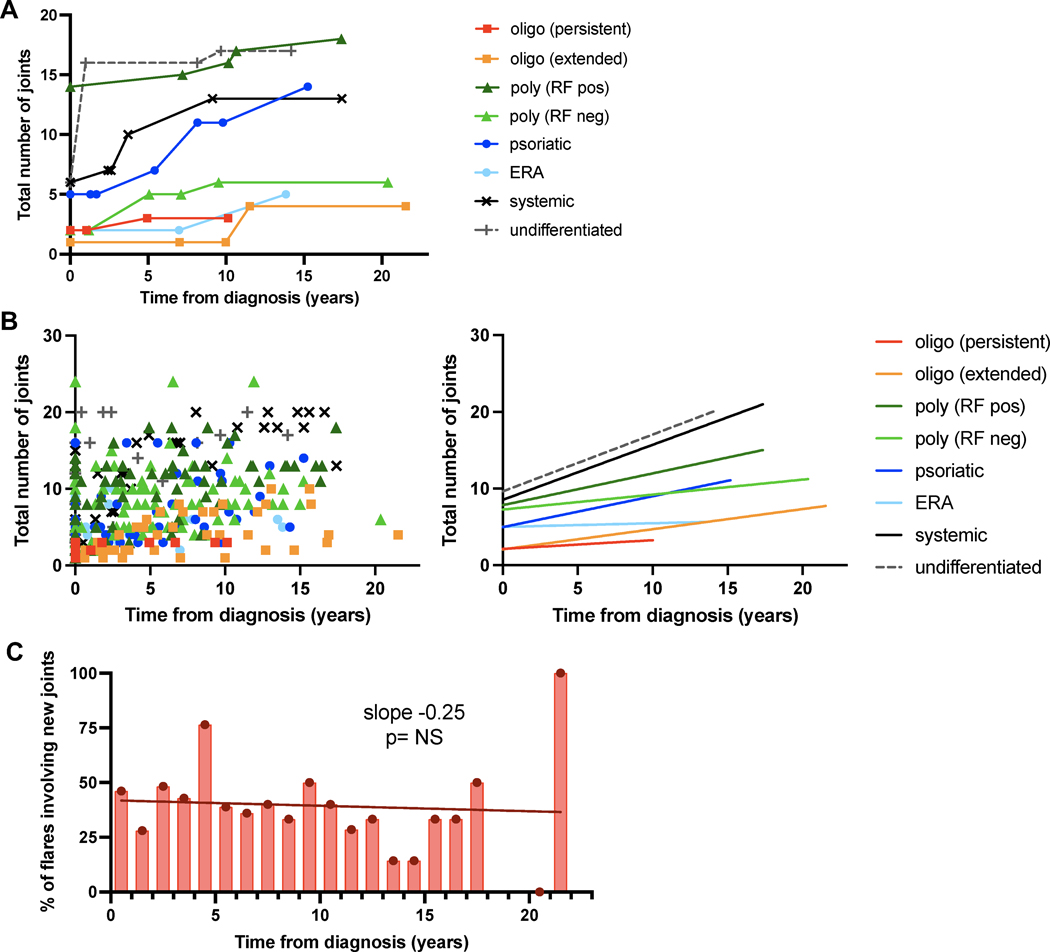
Figure 4. Arthritic joints accumulate over time during disease flares.
(A) Illustrative patients from each JIA subtype followed for at least 10 years, exhibiting a gradual increase in the number of affected joints with time. Each line represents an individual patient; each data point reflects an encounter for arthritis diagnosis or disease flare. (B) Total number of arthritic joints involved over time. (Left) Each patient contributes multiple data points and each dot represents an encounter for arthritis diagnosis or flare (n=348 encounters). (Right) Linear regression curve for each JIA subtype. Spearman correlation p<0.05 for all subtypes except enthesitis related arthritis (ERA). (C) Proportion of flares that recruit new joints over time (n=102 new joints, 253 flares). RF, rheumatoid factor.

