
Figure 1.
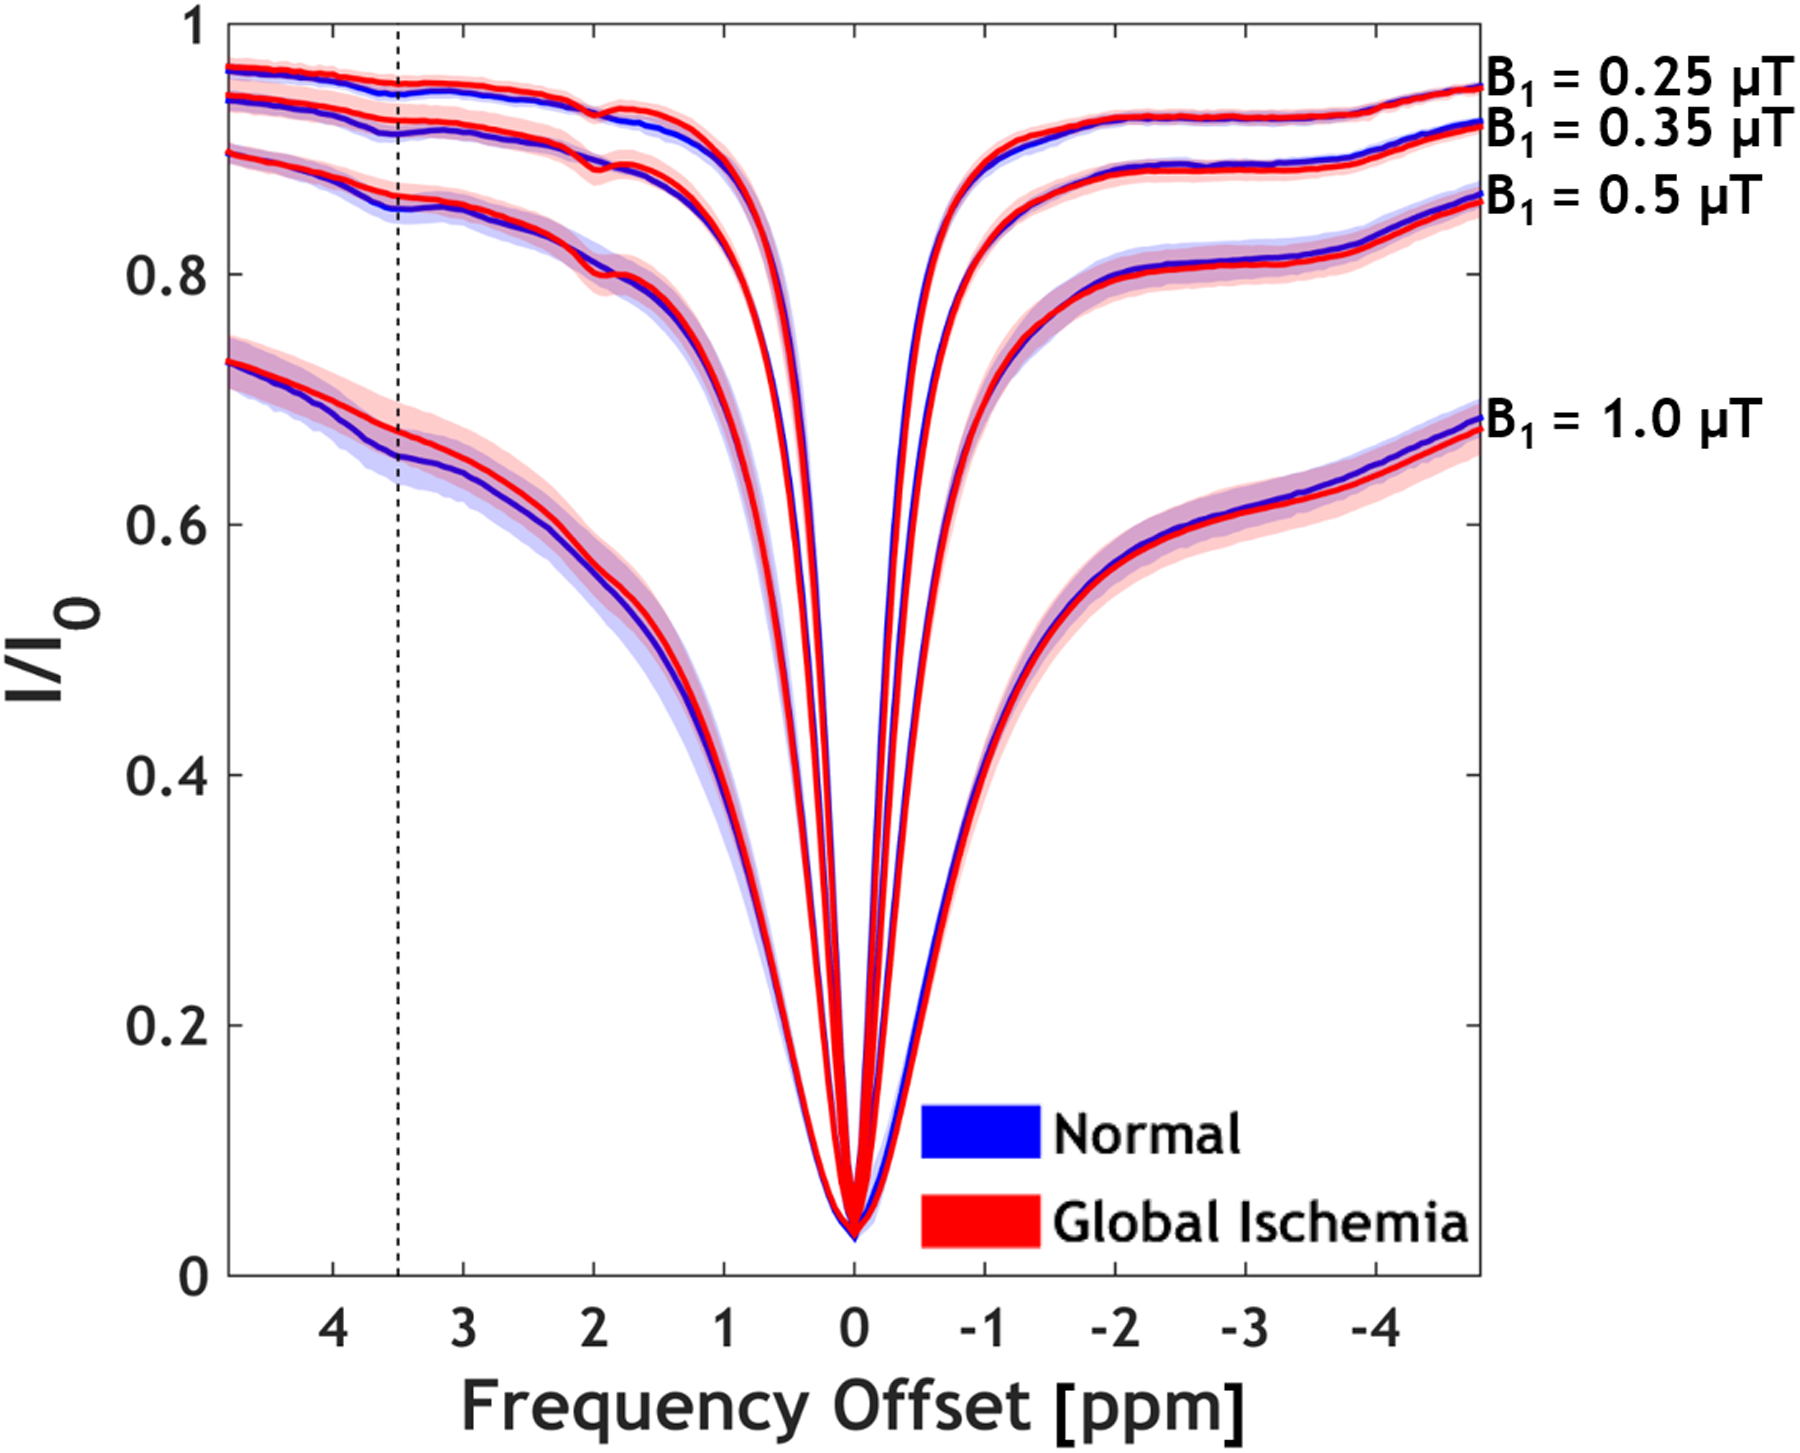
CEST Z-spectra averaged across all brain voxels before and after global ischemia. Mean with shaded standard deviation are shown (N = 6). Most notable are CEST effect changes at 3.5 ppm (APT) and 2 ppm (guanidinium) CEST effects.
Official websites use .gov
A
.gov website belongs to an official
government organization in the United States.
Secure .gov websites use HTTPS
A lock (
) or https:// means you've safely
connected to the .gov website. Share sensitive
information only on official, secure websites.
CEST Z-spectra averaged across all brain voxels before and after global ischemia. Mean with shaded standard deviation are shown (N = 6). Most notable are CEST effect changes at 3.5 ppm (APT) and 2 ppm (guanidinium) CEST effects.