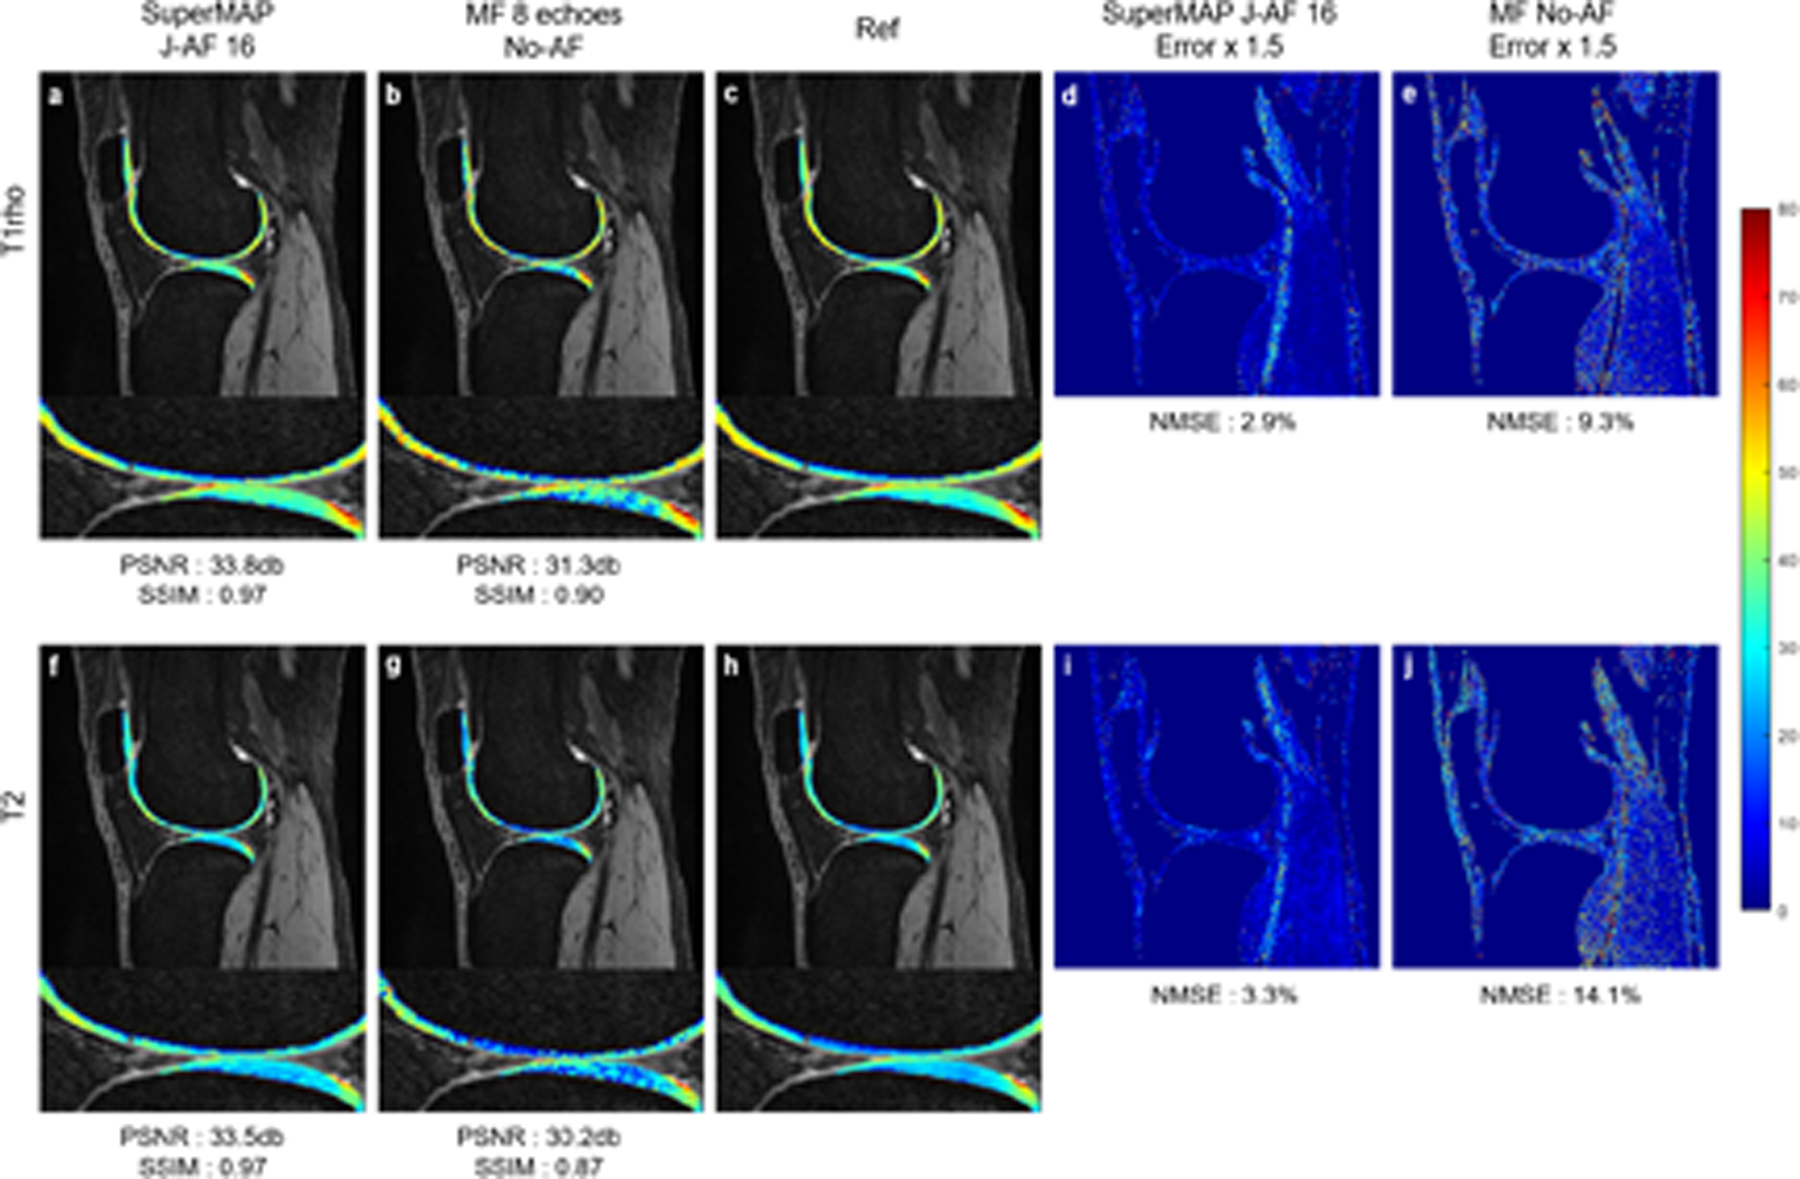
FIGURE 7.

T1rho maps (top) and T2 maps (bottom) reconstructed using SuperMAP from 2 noisy contrast images with additional 4× k-space undersampling (J-AF = 16) (a)(f), from 8 fully sampled noisy data using the exponential model fitting (b)(g), the corresponding error maps (d)(e)(i)(j), respectively, and the reference (c)(h).
