Figure 2.

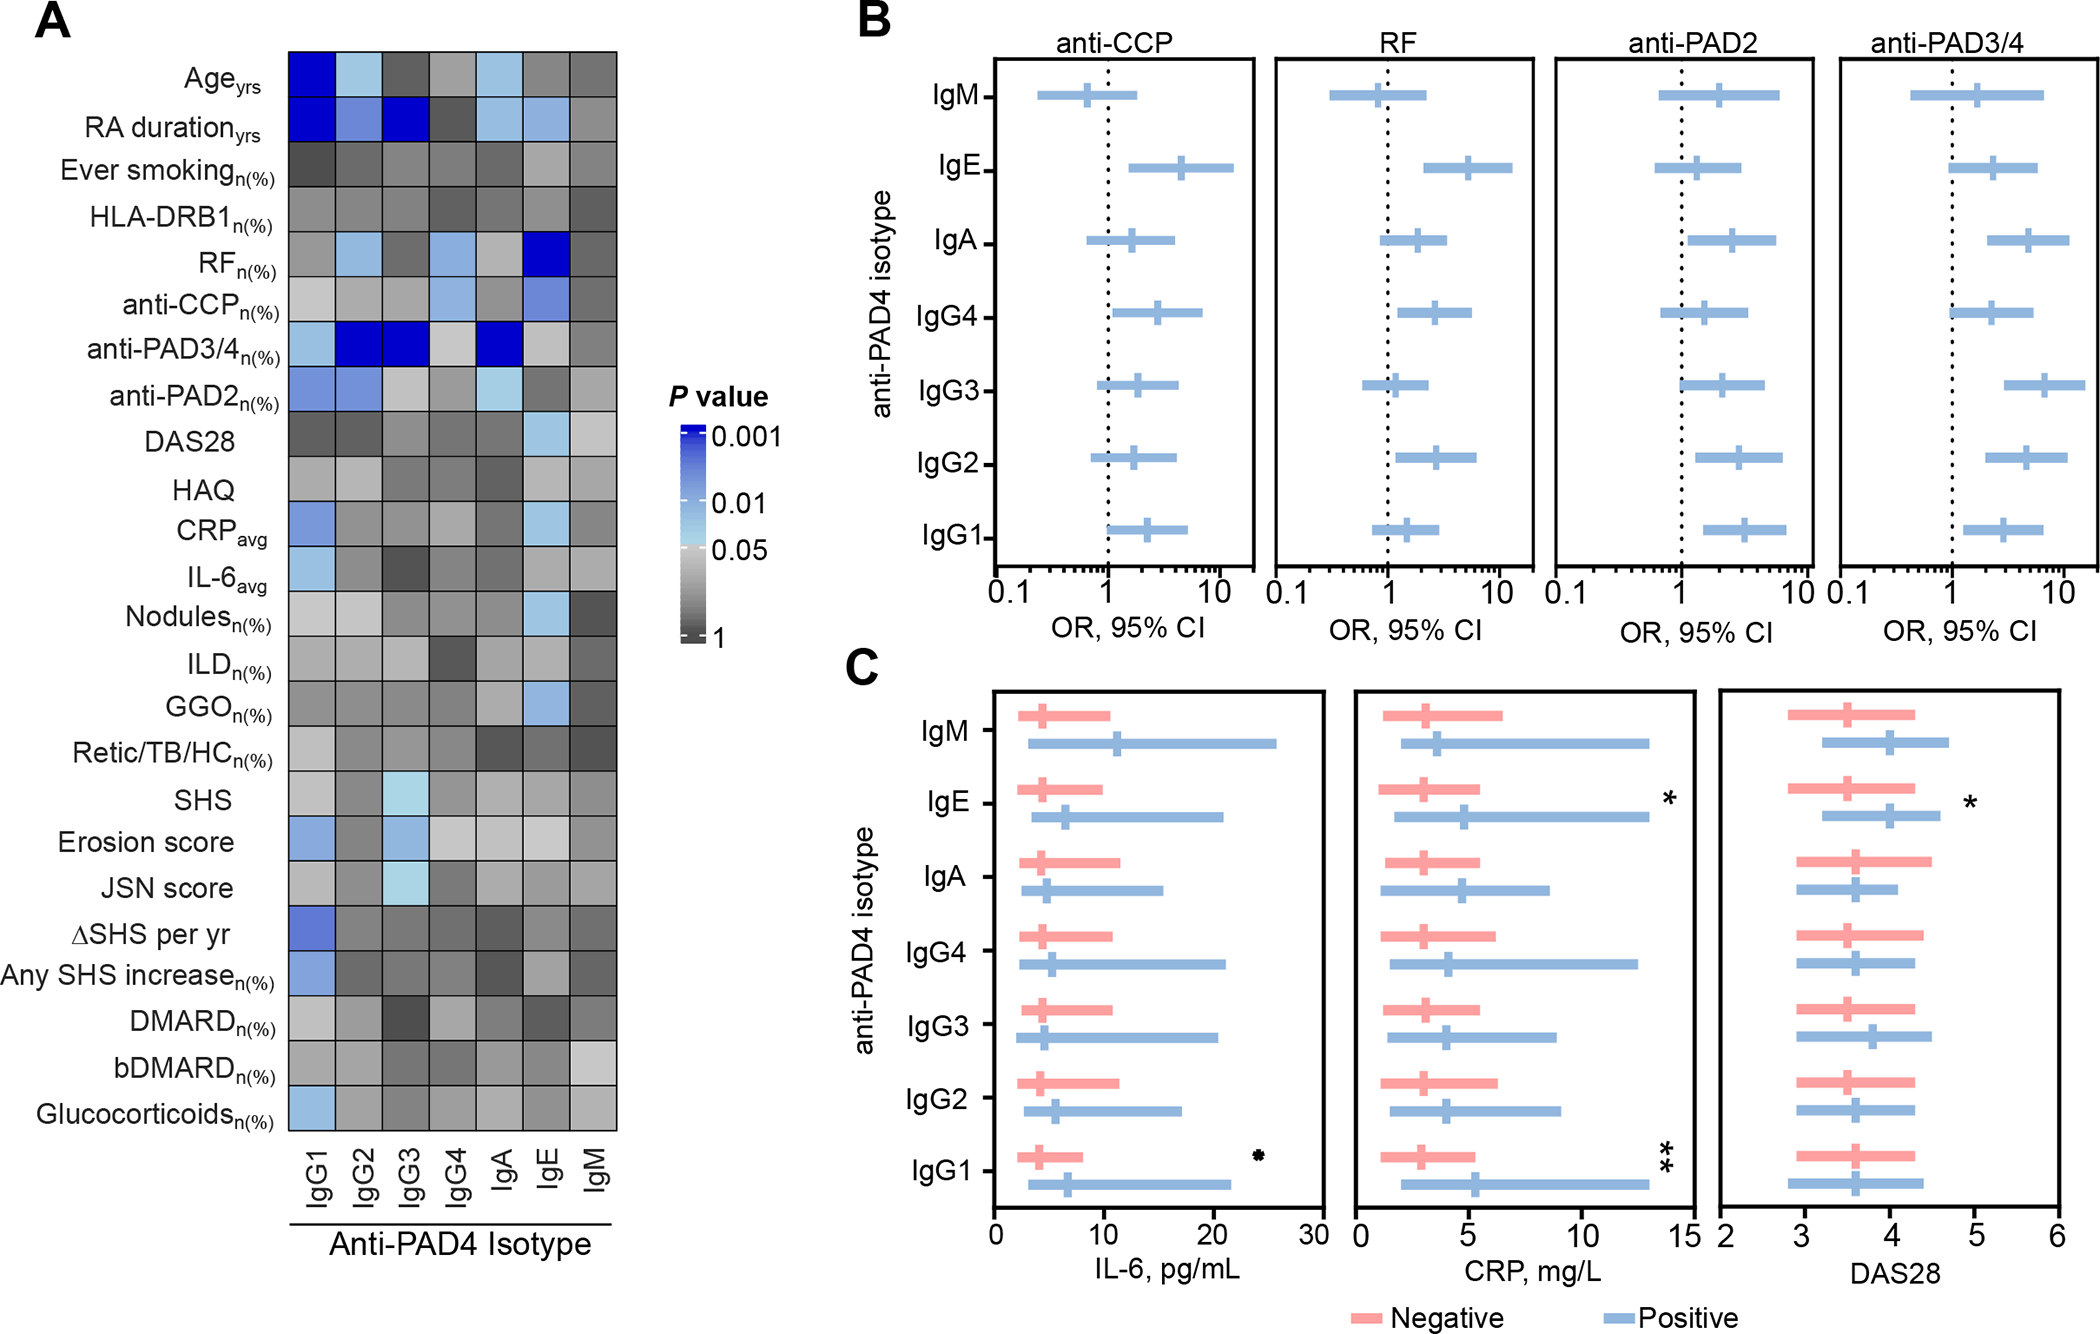
Clinical associations between the anti-PAD4 antibody subsets in RA. A, Heat map showing the demographic and clinical associations with anti-PAD4 antibody types in RA (n=196). The color scale represents −log2 P value, obtained from the comparison of the corresponding anti-PAD4 isotype positive vs. negative, using Student’s T test or χ2 as appropriate. In the color scale, blue represents the associations with a P value < 0.05. All significant associations, represent variables positively associated with the indicated anti-PAD4 isotype. B, Associations between anti-PAD4 antibody subsets with other known serological biomarkers. Bars represent OR with 95% CI. C, Comparison of serum IL-6, CRP and DAS28 between RA patients negative and positive for anti-PAD4 antibody subsets. Bars represent the median and IQR range. Yrs, years; SE, shared epitope; PAD, peptidylarginine deiminase; DAS28 disease activity score on 28 joints. HAQ, health assessment questionnaire; CRPavg, average study c-reactive protein; IL-6, interleukin-6; ILD, interstitial lung disease; GGO, ground glass opacification; retic/TB/HC, reticulation/traction bronchiectasis/honeycombing; SHS, Sharp/van der Heijde Score; JSN, joint space narrowing; DMARD, disease-modifying antirheumatic drugs; bDMARD, biological DMARD. *P < 0.05, **P < 0.01, ***P < 0.001.
