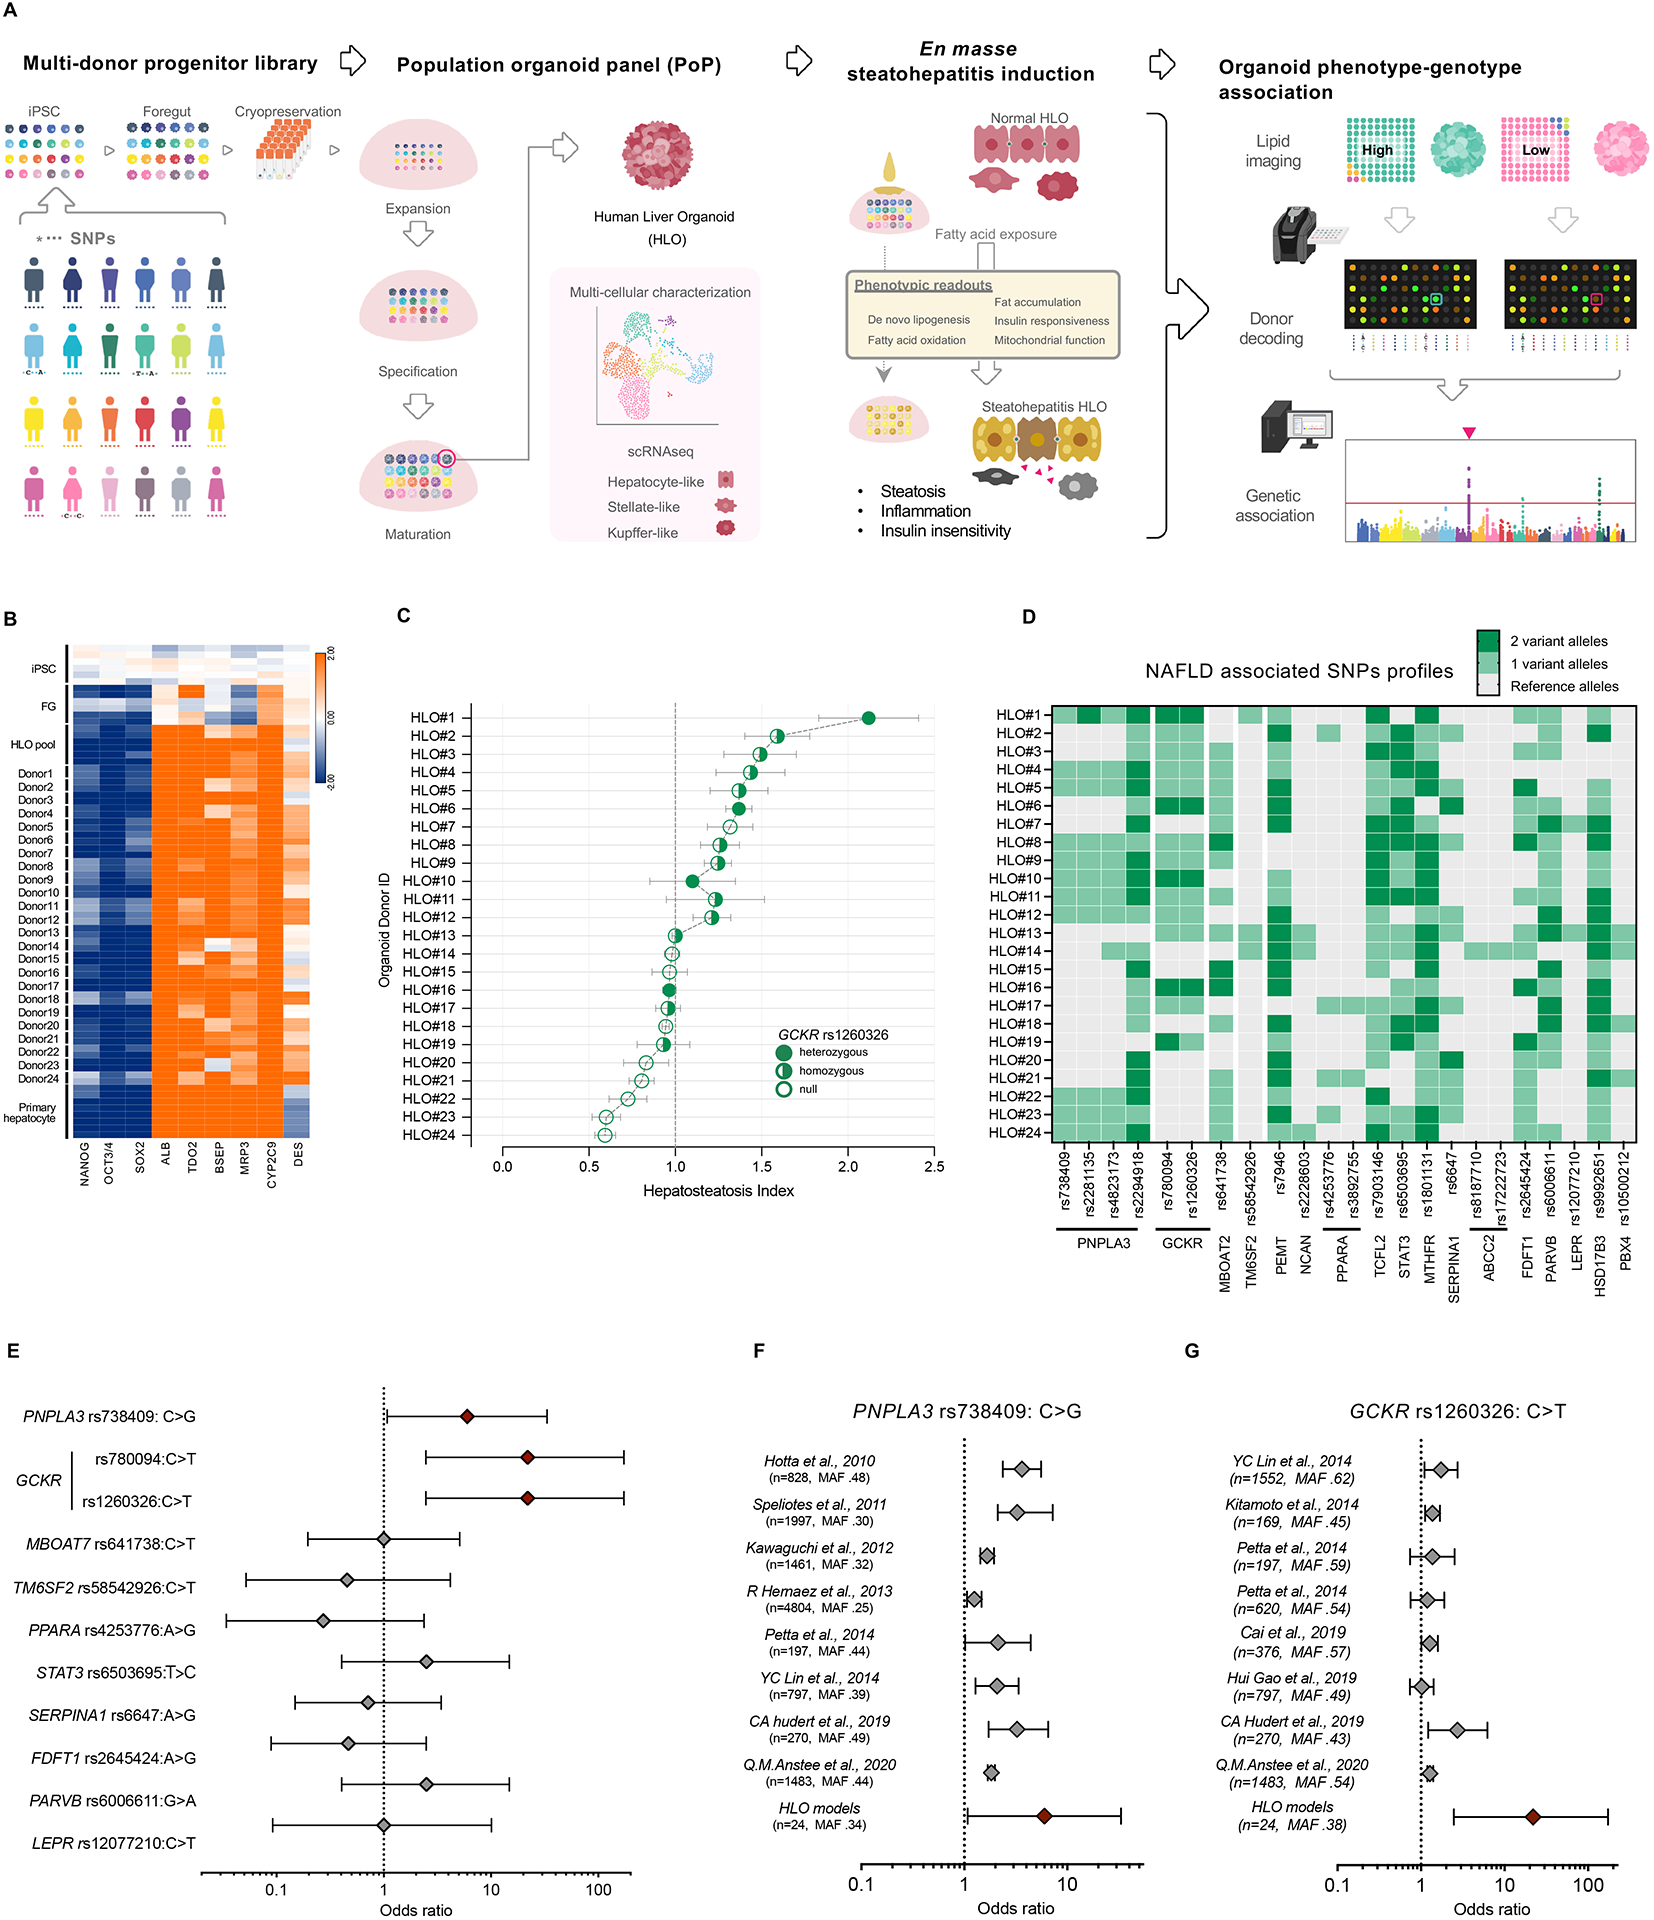
Figure 1. A steatohepatitis organoid panel informs known genotype-phenotype associations for hepatic steatosis.

(A) Schematic diagram of the developing genetically diverse population organoid panel (PoP). A mixture of cryopreserved foregut progenitors from multiple donors enabled parallel and clonal production of multicellular human liver organoids. Oleic acid (OA) treatment induces steatohepatitis phenotype. PoP based genotype-phenotype association analysis was performed en masse. (B) Transcriptome analysis of HLOs from 24 donors. (C) Graph shows the mean ± sem of hepatosteatosis index in each donor determined by fluorescent-guided PoP steatosis screening. SNP rs1260326 zygosity is as indicated. (D) SNP genotype profiles associated with NAFLD in the 24 donors of PoP. Dark green indicates 2 variant alleles, light green indicates 1 variant allele. (E) The odds ratios (ORs) for the 24-donor sHLO model, based on the fat accumulation phenotype. The OR was calculated for major NAFLD-related SNPs. Error bars represent 95% confidence intervals. (F) Comparison of diagnostic odds ratios in clinical trials to odds ratios of HLO models for PNPLA3-rs738409. The sample size (n) and minor allele frequency (MAF), as indicated. (G) Comparison of diagnostic odds ratios in clinical trials to odds ratios of HLO models for GCKR-rs1260326.
