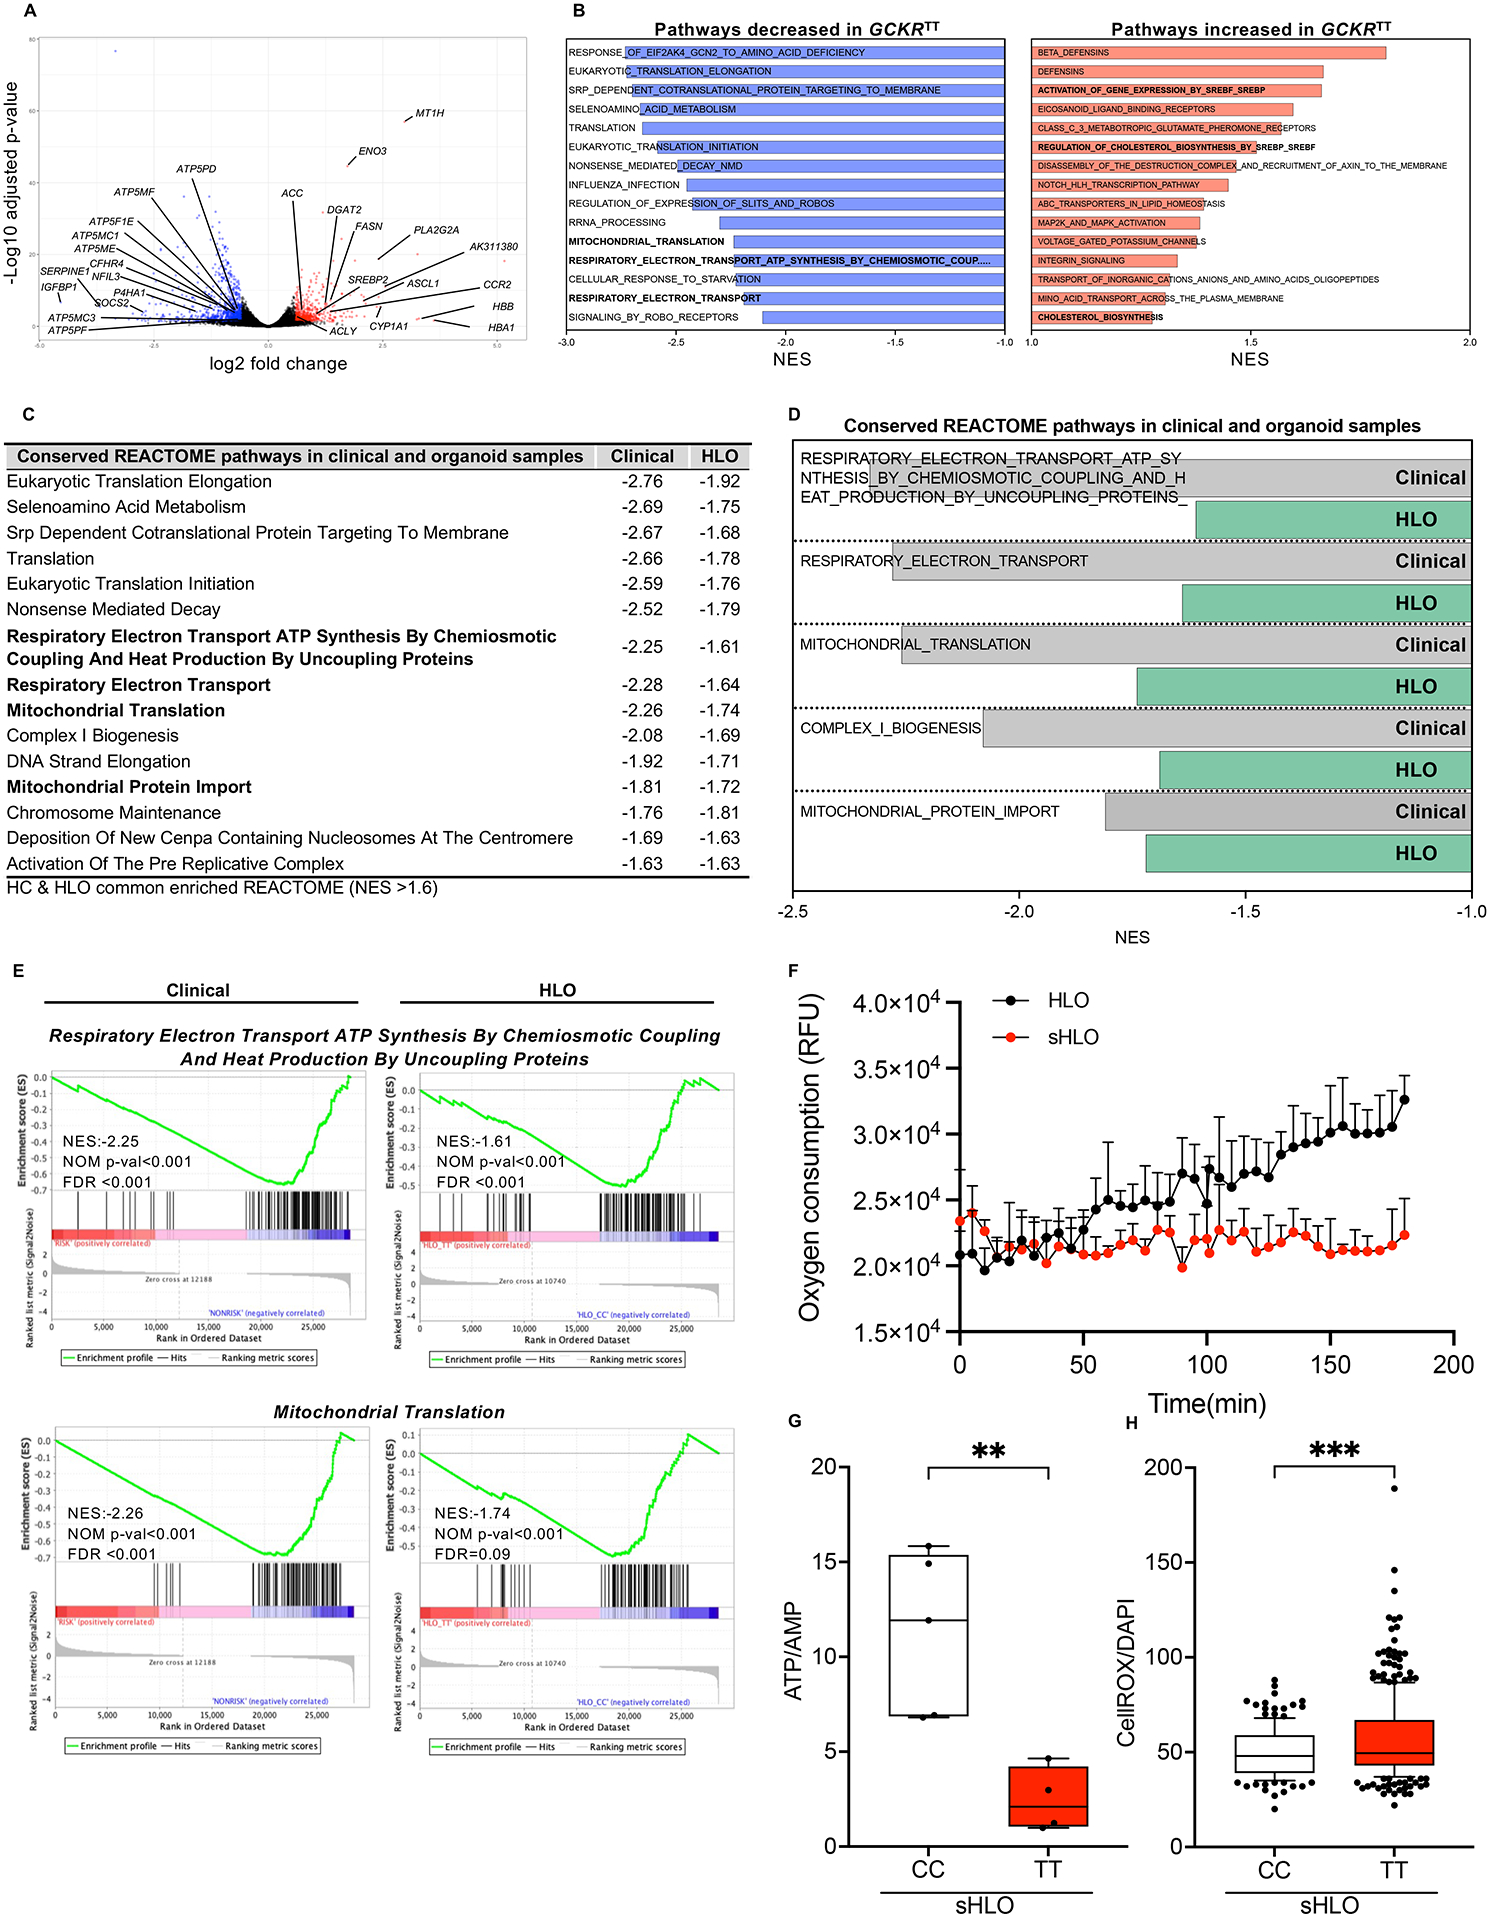
Figure 4. Comparative clinical and organoid transcriptomic signatures associated with GCKR-rs1260326.

(A) Volcano plot of differentially expressed gene (DEGs) analysis (edge R) in primary NASH hepatocytes comparing GCKRTT to CC variants. Fold change >1.5, P-value <0.05. (B) Unbiased gene set enrichment analysis (GSEA). REACTOME pathways up-regulated and down-regulated in primary NASH hepatocytes, GCKRTT relative to GCKRCC. Normalized enrichment scores (NES) are presented in descending order. (C) Conserved GSEA-REACTOME pathways in primary NASH hepatocytes (clinical samples) and HLOs (GCKRTT relative to GCKRCC). NES less than −1.6 are shown. (D) Conserved GSEA-REACTOME mitochondrial-related pathways in clinical (primary NASH hepatocytes) and HLO models. (E) Enrichment plots of selected gene-expression profiles based on GSEA-REACTOME evaluations. (F) Oxygen consumption rate (OCR) analysis (Extracellular Oxygen Consumption Assay, a fluorescence-based assay) of GCKRTT-HLO and -sHLO. Data are shown as means ± SD. (error bars), n=3. (G) The ratio of ATP/AMP of GCKRTT and GCKRCC-sHLO was analyzed by NMR (nuclear magnetic resonance) spectroscopy. Data are shown as means ± SD (error bars), n for GCKRCC-HLO = 5, n for GCKRTT-HLO =4 donors. Unpaired t-test; **p < 0.01. (H) Quantifications of reactive oxidant species (ROS) production in GCKRTT-sHLOs versus GCKRCC-sHLOs. ROS production was detected with CellROX live staining and Hoechst 33342 for the nucleus. The intensity of ROS was normalized to nuclear signals. Analysis was performed in >50 organoids per line, three independent experiments. Unpaired t-test; ***p < 0.001.
