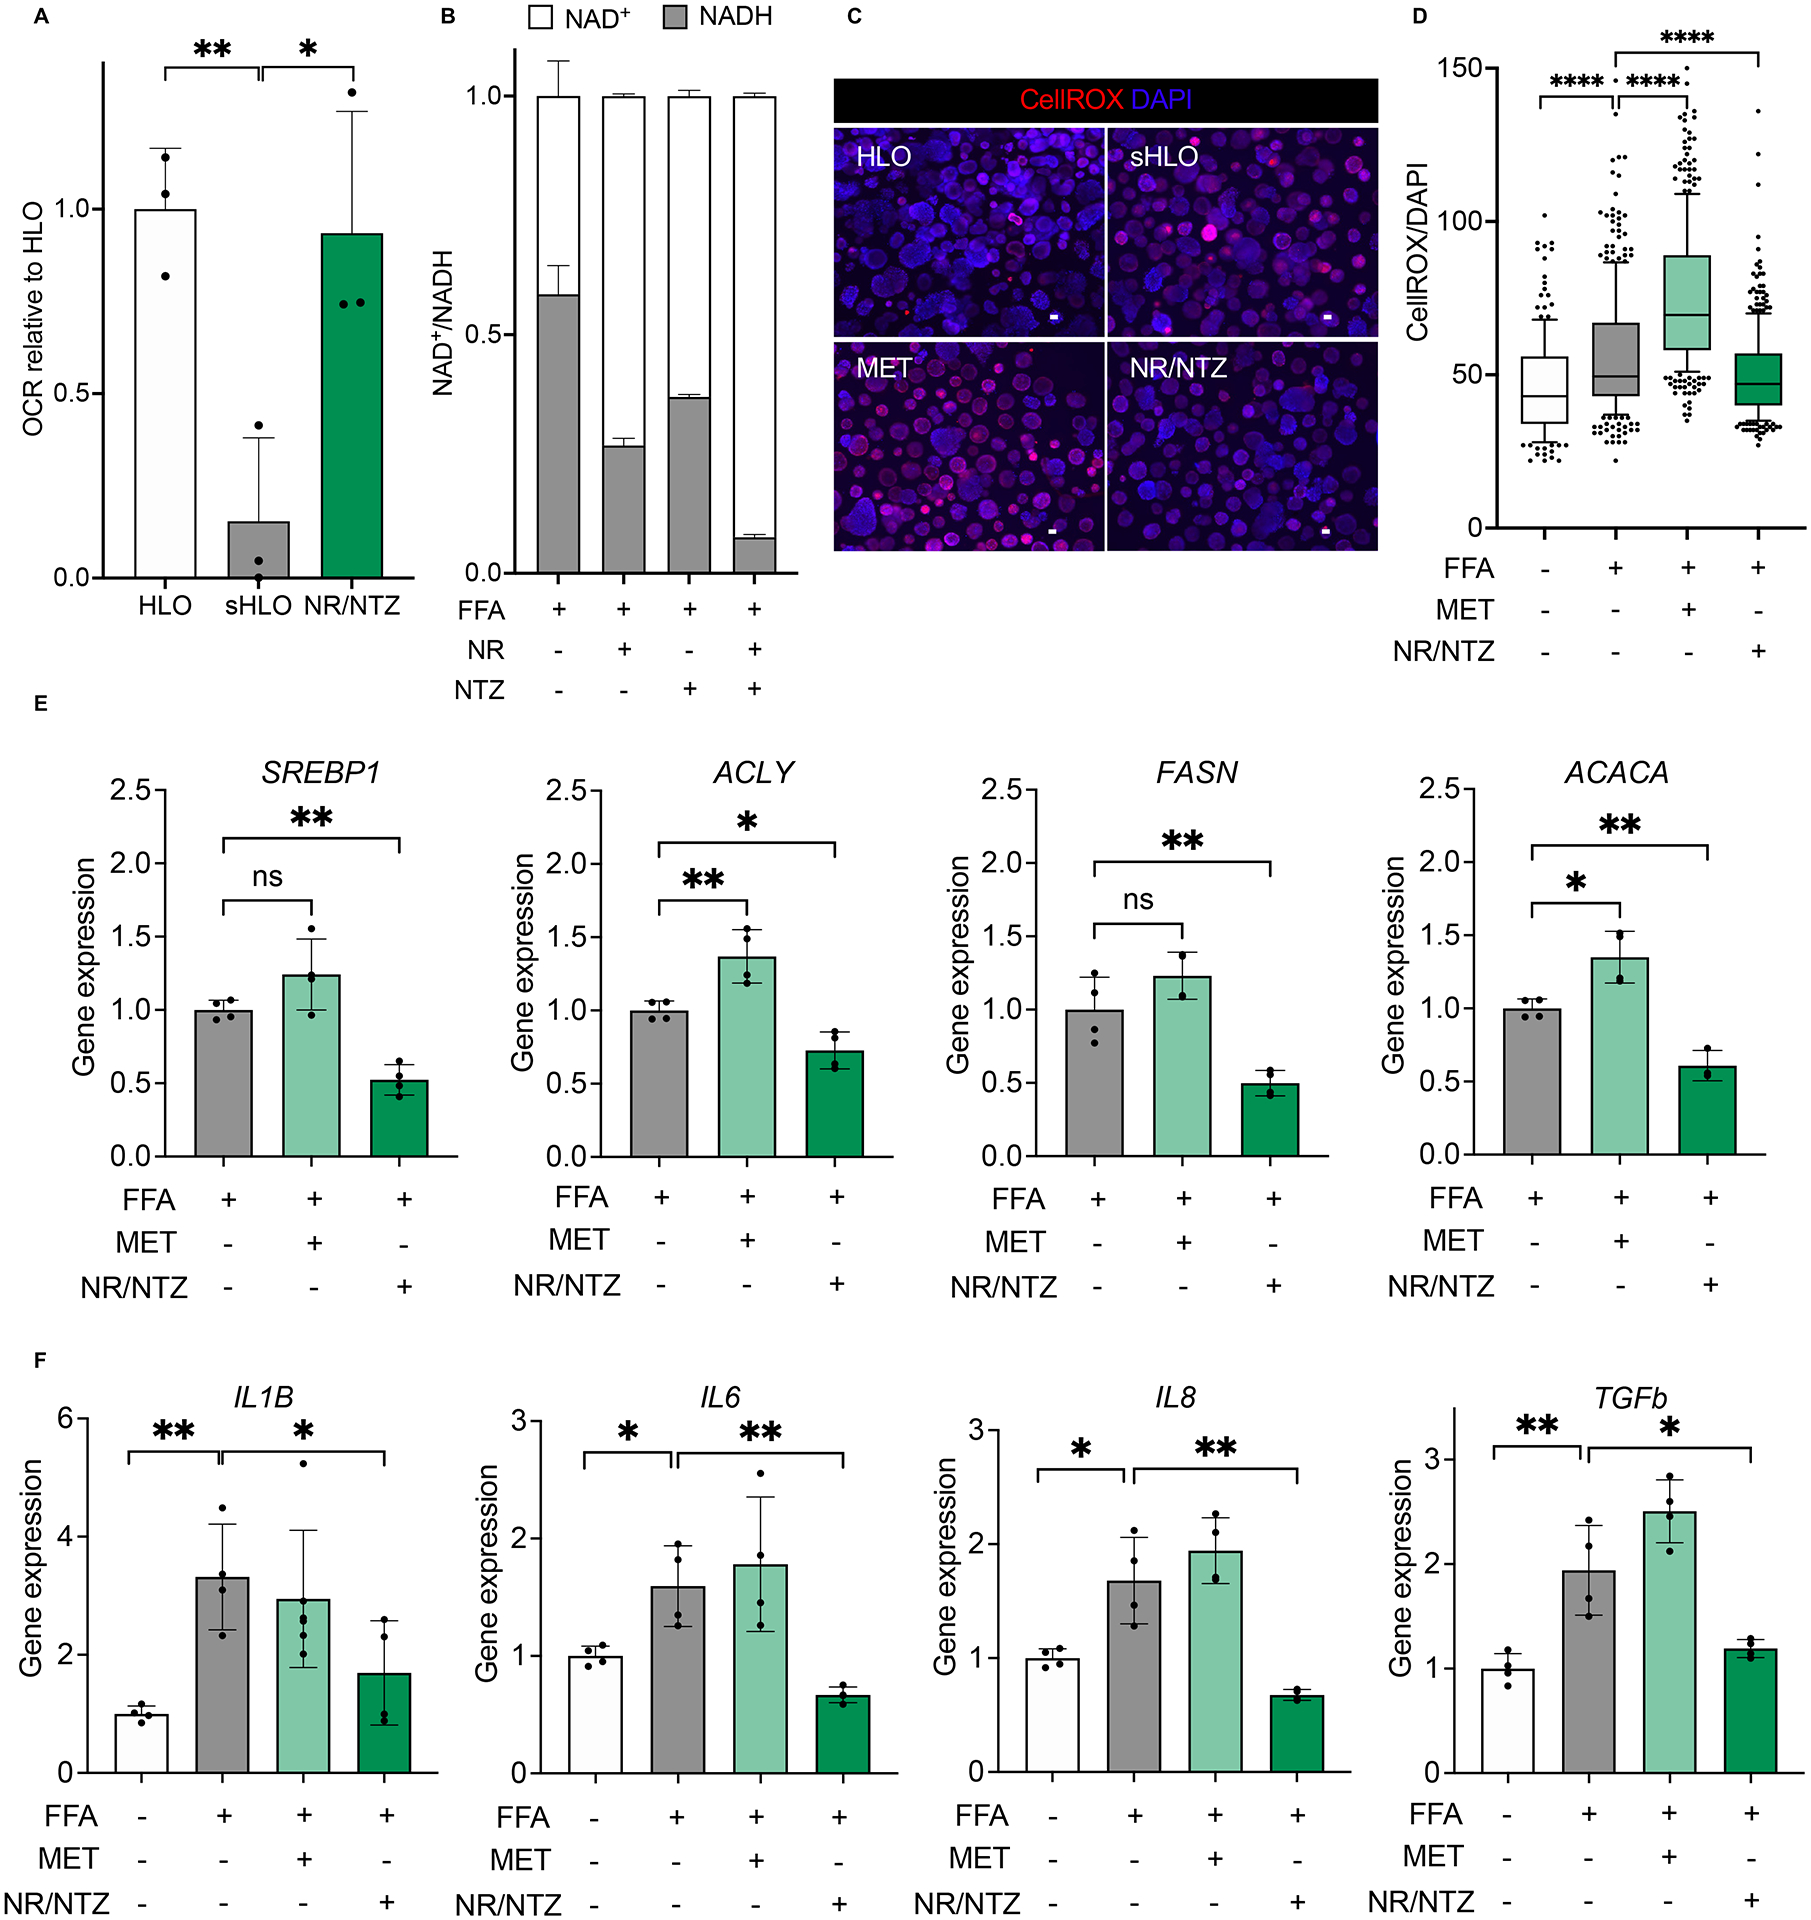
Figure 5. Mitochondrial dysregulation is associated with GCKR-rs1260326 related metabolic assaults.

(A) Oxygen consumption rate (OCR) analysis of GCKRTT-HLO (white), -sHLO (gray), and -sHLO treated with nicotinamide riboside (NR), nitazoxanide (NTZ) combination (green). Data are shown as means ± SD (error bars), n=3, Unpaired t-test; *p < 0.05, **p < 0.01. (B) NAD+/NADH ratios in GCKRTT-sHLO treated with NR, NTZ, or combination. (C) Representative images of ROS production in GCKRTT-HLO, -sHLO (FFA treated), and -sHLO treated with metformin (MET) or a combination of NR/NTZ. Images were stained with CellROX for ROS and Hoechst 33342 for the nucleus. Scale bars, 300μm. (D) Quantifications of ROS production in GCKRTT-HLO, -sHLO (FFA treated), and -sHLO treated with metformin (MET) or a combination of NR/NTZ. ROS production was detected with CellROX live staining and Hoechst 33342 for the nucleus. The intensity of ROS was normalized to nuclear signals. Analysis was performed in >50 organoids per line, three independent experiments. Unpaired t-test; ****p < 0.0001. (E) Lipogenic gene expression in GCKRTT-sHLO (FFA treated) and -sHLO treated with metformin (MET) or NR/NTZ combination were compared to GCKRTT-HLO. Data are shown as means ± SD normalized by internal standard 18S (error bars), n=4. Unpaired t-test; *p<0.05, **p<0.01. (F) Relative gene expressions of proinflammatory cytokine in GCKRTT-sHLO (FFA treated) and -sHLO treated with metformin (MET) or NR/NTZ combination, compared to GCKRTT-HLO, which was arbitrarily assigned a value of 1. Data are shown as means ± SD. (error bars), n=4. Unpaired t-test; *p < 0.05, **p < 0.01.
