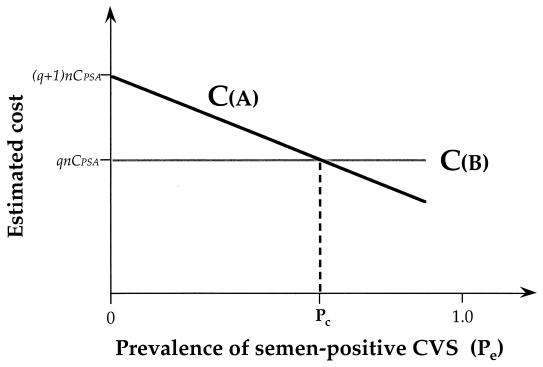
FIG. 2.
Estimated costs of strategy A (detection of PSA in all cervicovaginal samples and use of Y PCR for PSA-negative samples) (CA) and strategy B (Y PCR in all samples), CB, as a function of the expected prevalence of semen residue in the study population (Pe), according to equations A2 and A3, assuming that factor β1 is very close to 0 (β1 ≈ 0) and that the cost of Y PCR is q-fold that of PSA immunochemical detection (q > 1). When the Pe reaches the critical value Pc in the study population (≈0.66, according to equation A8, where α1 = 0.50 and q = 3), CA and CB are equivalent. Strategy A is preferable if Pe is >66% in the study population; below Pc, strategy B is less expensive and should be preferred.

