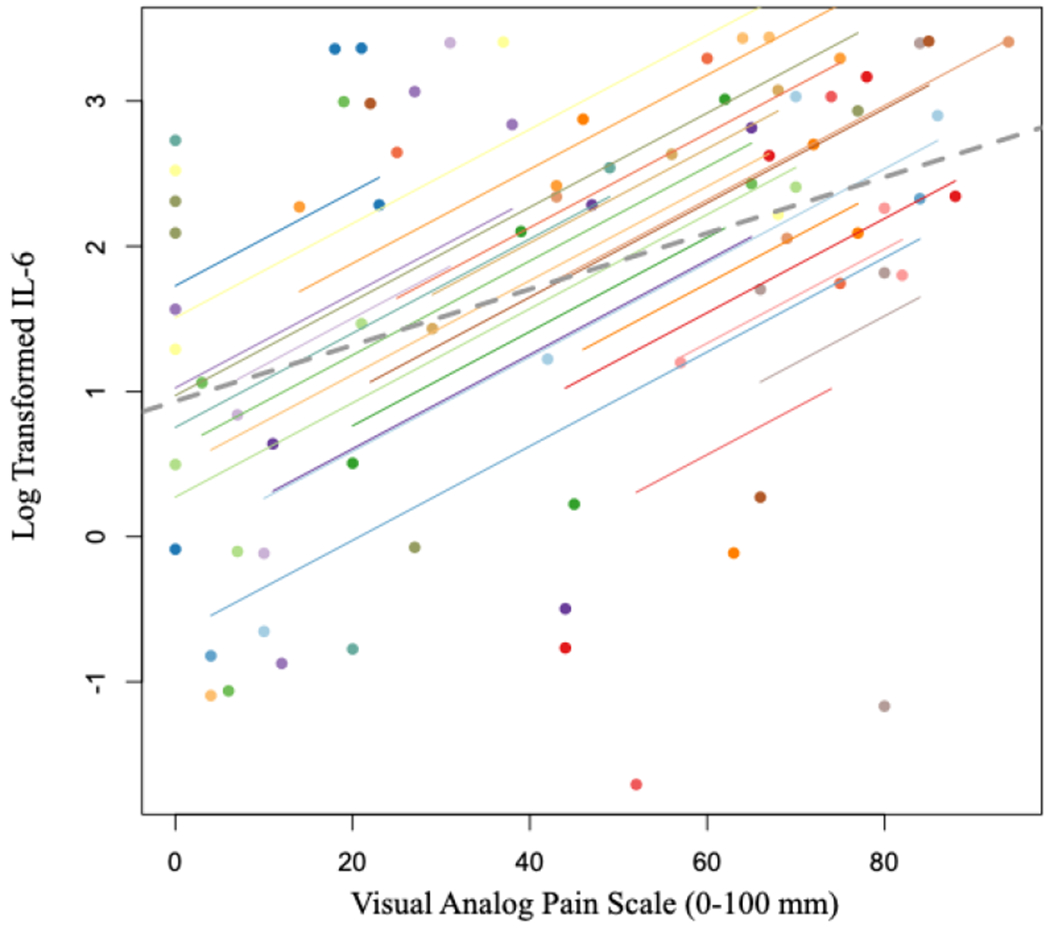
Figure 1:

Scatterplot of log transformed IL-6 values and VAS Pain Scores. Participants’ data and corresponding lines are shown in different colors, and the dashed grey line represents the regression line if each participant’s data was averaged across the four time points.
