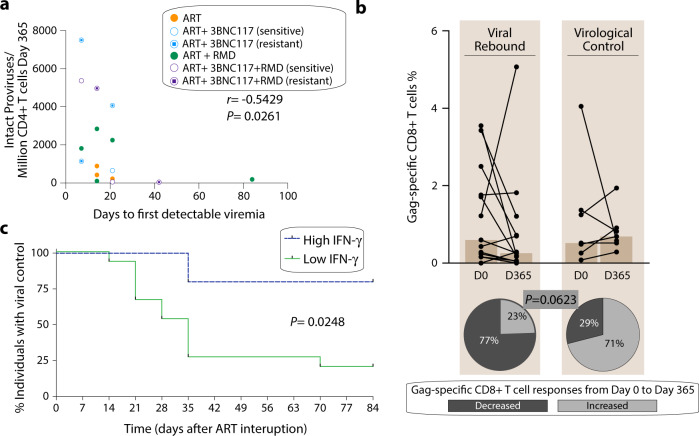
Fig. 4. Correlation of ART-free virological control.
a Correlation between the number of intact proviruses detected per million of CD4+ T cells detected after 365 days of ART (immediately preceding ATI) and days to first detectable viremia during ATI (n = 17). Individual dots are color-coded according to the groups. R and P-values were calculated using two-sided Spearman rank-order correlation. b Frequency of Gag-specific CD8+ T cell and percentage of individuals showing a decreased or increased frequency of Gag-specific CD8+ T cell responses (%) from Day 0 to Day 365 is shown for individuals that experienced a viral rebound (left, n = 13) in comparison to individuals that maintained a virological control during the ATI period (right, n = 7). P-value was calculated using two-sided Fisher’s exact test. c The proportion of individuals with high INF-γ (>750 pg/mL) versus low INF-γ (<750 pg/mL) who maintained viral control during 12 weeks of ATI (n = 20). P-value was calculated using log-rank test. Source data are provided as a Source Data file.

