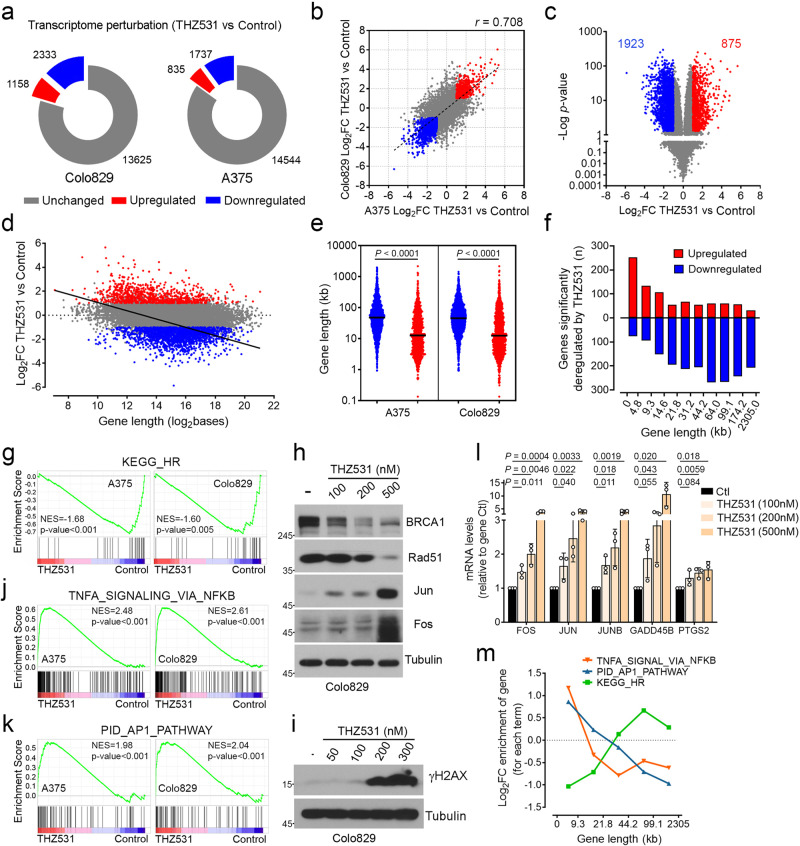
Fig. 4. CDK12 inhibition increases the expression of growth-promoting genes.
a Global transcriptome changes associated with THZ531 (500 nM) treatment for 6 h in Colo829 (left) and A375 (right) cells. b Correlation between THZ531-induced gene expression changes in Colo829 and A375 cells. Displayed r = 0.703 value was determined using Pearson correlation. c Global THZ531-induced transcriptome changes (Colo829 and A375). d Correlation between THZ531-induced transcriptome changes in cells (A375 and Colo829) and gene length. Linear regression for significant perturbed genes is displayed (Slope −0.3297, p-value <0.0001). e Gene length of significant up- and downregulated genes by THZ531 treatment (A375, Colo829). f Number of genes up- or downregulated relative to gene length. The genome was ranked from smaller to longer genes and fractioned into 10 groups containing the same number of genes. g GSEA analysis revealed that the KEGG_HOMOLOGOUS_RECOMBINATION gene set is decreased in both THZ531-treated cells. Immunoblot of Colo829 cells treated for 12 h (h) or 24 h (i) with increasing concentrations of THZ531. j, k GSEA analysis revealed that the TNFA_SIGNALING_VIA_NFKB and PID_AP_PATHWAY gene sets are positively enriched in both THZ531-treated A375 and Colo829 cells. l qPCR of Colo829 cells treated for 6 h with THZ531. m Enrichment of the number of genes according to their length for the indicated GSEA term. The genome was ranked from smaller to longer genes and fractioned into 5 groups containing the same number of genes. Data are represented as mean of n = 3 independent biological replicates for each cell line (a, b, g, j, k) and n = 6 (A375 and Colo829) (c, d, f). Length of deregulated genes from n = 3 independent biological replicates for each cell line (e). For panels (a–f) Log2 FC (THZ531/Control) above 1 or below −1 (twofold) and P-values ≤ 0.05 were respectively considered as significantly upregulated (red) or downregulated (blue). (h, i) Representative data of independents n = 3. Data are represented as mean ± SD of independent experiment, n = 3 (l). Significance was determined using Wald test (c), or unpaired two-tailed Student’s t-tests (e, l). Source data are provided as a Source Data file.

