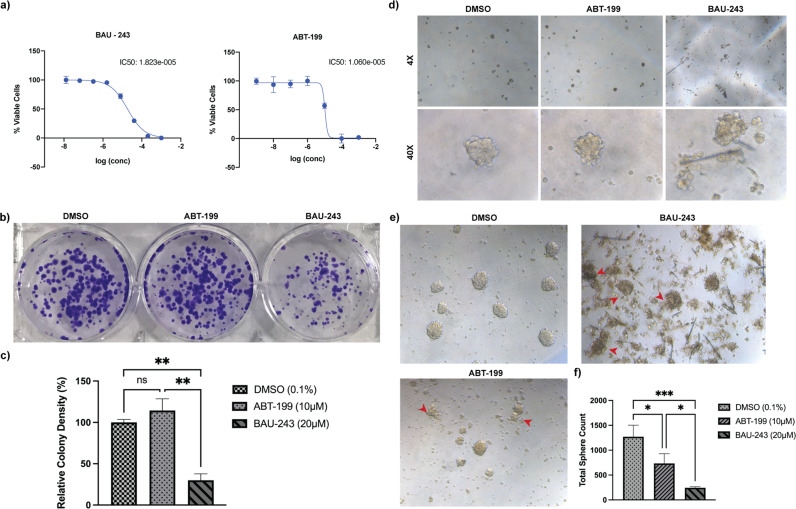
Fig. 2. Tumor-initiating cancer cells were reduced by BAU-243.
a IC50 calculation of BAU-243 and ABT-199 treated A172 cells. Concentrations for BAU-243 are ranging between 1 mM to 2.56 nM, diluted 5-fold for each concentration. Concentrations for ABT-199 are ranging between 1 mM to 1 nM, diluted 10-fold for each concentration. Percentage viable cell measurements were normalized to DMSO (0.1%) control group. IC50 values were calculated by Prism 9 software. b Colony formation assay of YKG1 cells. Images of DMSO (0.1%), ABT-199(10 µM), and 243 (20 µM) treated YKG1 colonies on day 8 (n = 2). Cells were fixed with ice-cold methanol and stained with 0.05% Crystal Violet. c Percentage relative colony density normalized to the DMSO control group. Colony density was determined as pixel counting by Adobe Photoshop. d Initial tumorsphere formation of YKG1 cells on the 4th day after treatment with DMSO (0.1%), ABT-199 (10 µM), or 243 (20 µM). Images are shown as 4X and 40X magnifications. e Tumorsphere formation of YKG1 cells on day 8 after treatment. Images are shown as 20X magnification. Red arrows indicate disintegrated spheres. f Total sphere count of DMSO (0.1%), ABT-199 (10 µM), or 243 (20 µM) treated cells on day 8. Data are expressed as mean ± SD. Statistical analysis was performed using an ordinary one-way ANOVA, together with Dunnett’s multiple comparisons test. *p < 0.05, **p < 0.01, ***p < 0.001, ns not significant.

