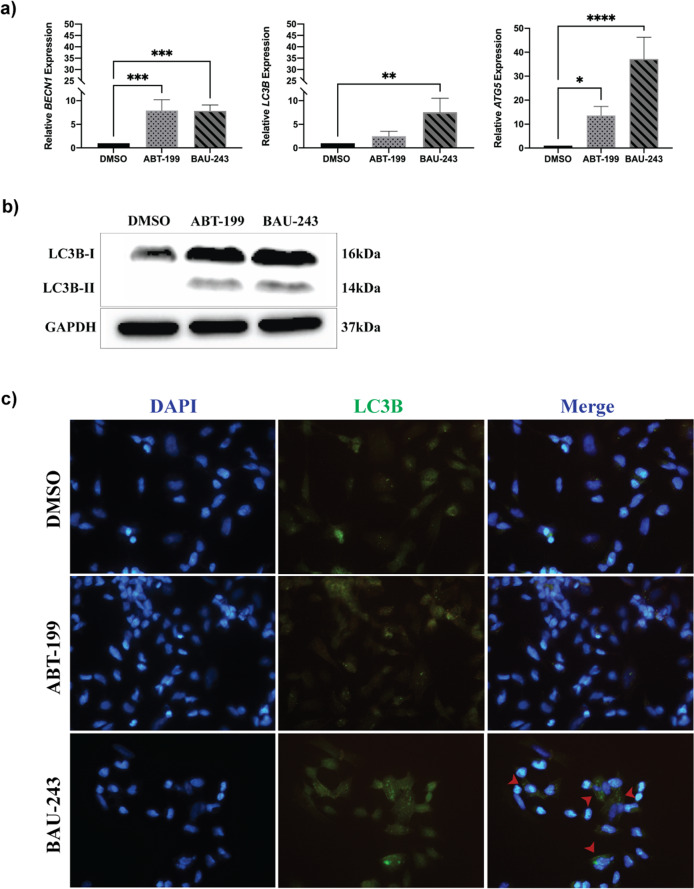
Fig. 5. BAU-243 treatment induced autophagic cell death.
a Quantitative RT-PCR of BECN1, MAP1LC3B, and ATG5 of DMSO (0.1%), ABT-199 (10 µM), and BAU-243 (20 µM) treated A172 cells. Cq values are normalized to GAPDH expression, and 2-ddct values were calculated (n = 4). b Western blotting of LC3B. 20 µg protein per lane was loaded. GAPDH was used as a control. c Immunocytochemistry fluorescence microscopy images (40X) of DMSO (0.1%), ABT-199 (10 µM), and 243 (20 µM) treated SHSY-5Y cells. DAPI is represented with blue and LC3B is represented with green. Red arrows indicate autophagosomes. Data are expressed as mean ± SD. Statistical analysis was performed with ordinary one-way ANOVA, together using Dunnett’s multiple comparisons test. *p < 0.05, **p < 0.01, ***p < 0.001, ****p < 0.0001.

