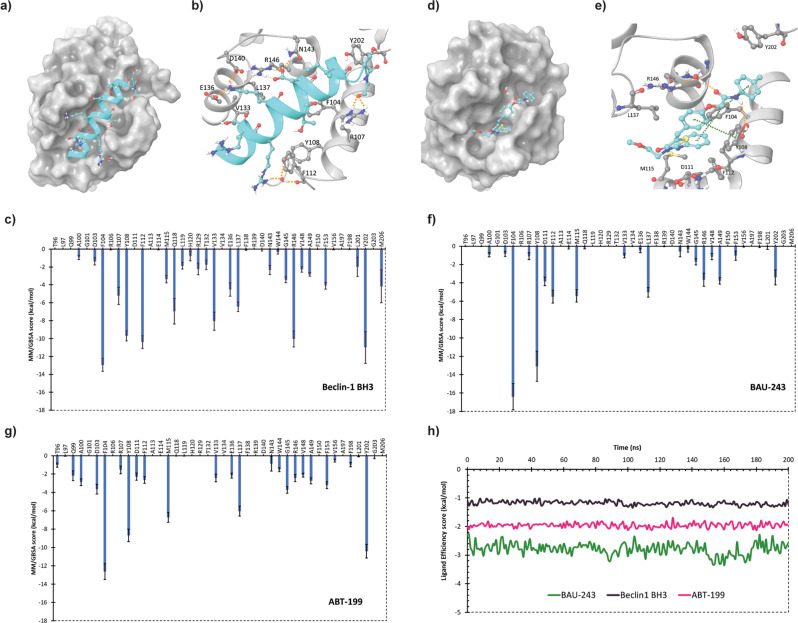
Fig. 6. BAU-243 interacted with BH3 binding domain of Bcl-2 protein.
a Bcl-2 in complex with Beclin 1 BH3 domain with Bcl-2 represented as gray colored surface. Water molecules and residues of Beclin 1 BH3 are displayed with the ball and stick representation with C atoms colored in dark cyan, O atoms in red, N atoms in dark blue, and polar H atoms in white. Orange dashed lines indicate hydrogen bonds. b 3D representation of interactions between Beclin 1 BH3 and Bcl-2 with Bcl-2 residue C atoms represented in gray and other atoms colored as in a. c Bcl-2 residues contribution plot for the estimated free energy of Beclin 1 BH3 and Bcl-2 complex calculated by MM/GBSA approach. d Bcl-2 in complex with BAU-243 with Bcl-2 represented as gray colored. Atoms in the ligand molecule are colored as explained in a. e 3D representation of interactions between BAU-243 and Bcl-2 with Bcl-2 residue C atoms represented in gray and other atoms colored as in (a). Orange dashed lines indicate hydrogen bonds while green dashed lines indicate π-π stacking interactions. f Bcl-2 residues contribution plot for the estimated free energy of BAU-243 and Bcl-2 complex calculated by MM/GBSA approach. g Bcl-2 residues contribution plot for the estimated free energy of ABT-199 and Bcl-2 complex calculated by MM/GBSA approach. h Ligand efficiency scores for Beclin 1 BH3, BAU-243, and ABT-199 were estimated throughout MD time.

