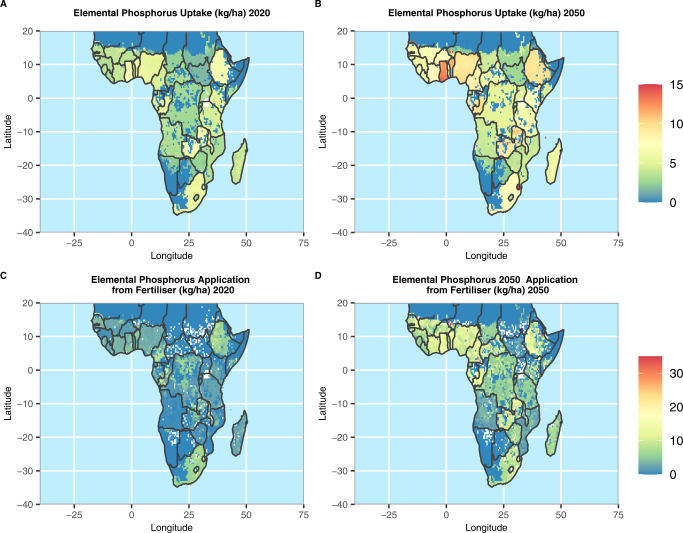
Fig. 3. Spatial distribution of annual phosphorus uptake and application rates (kg ha-1) in Sub-Saharan Africa for 2020 and 2050.
Spatial distribution of annual phosphorus uptake rates (kg ha−1) in Sub-Saharan Africa for 2020 (A) and 2050 (B). Spatial distribution of annual elemental phosphorus application rates from fertilisers (kg ha−1) for 2020 (C) and 2050 (D). All results were generated under the middle of the road SSP2 scenario. Country outlines made with Natural Earth vector files.

