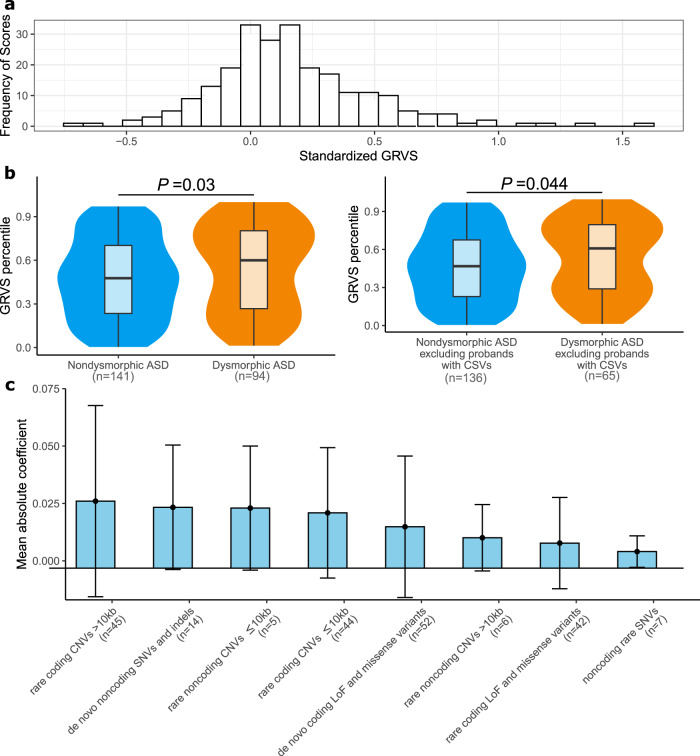
Fig. 3. Genome-wide rare variant score in ASD subtypes.
Events are comprised of variants for SNVs and indels or genes impacted by CNVs. For each sample, the GRVS is the sum of rare and de novo events in morphology-associated regions, weighted by effect size (estimated from the coefficients in the regression model). GRVSs were generated 30 times for each sample (see “Methods”), yielding an average score and average number of variants. CSVs, clinically significant variants. a Distribution of standardized GRVS for the discovery cohort (n = 235). b GRVSs for the whole cohort (left plot, n = 235) or the whole cohort excluding the 17 probands with clinically significant variants (right plot, n = 218), were ordered and ranked by percentile. Note that while 46 probands in the discovery cohort (n = 325) had CVSs, only 17 of them had two sequenced parents meeting inclusion criterion for the GRVS group (n = 235). The minima and maxima of box plots indicate 3× the interquartile range-deviated scores from the median, and the center indicates the median of the score percentiles. Violin plots show the distributions of the samples’ GRVS percentiles; box plots contained within show the median and quartiles of the percentiles for each subtype. P values denote the probability that the GRVS in dysmorphic ASD is not greater than nondysmorphic ASD (one-sided, Wilcoxon rank-sum test). c Rare variants have different effect sizes. The mean coefficient reflects the effect size of a variant type. Coefficients of deletions and duplications of the same size bin were averaged together. Coefficients of predicted LoF variants, missense variants, and predicted damaging missense variants were averaged together. Error bars indicate mean ± standard deviation. The number of morphology-associated regions for each variant type is indicated the y axis with “n =”. Source data are provided as a Source Data file.

