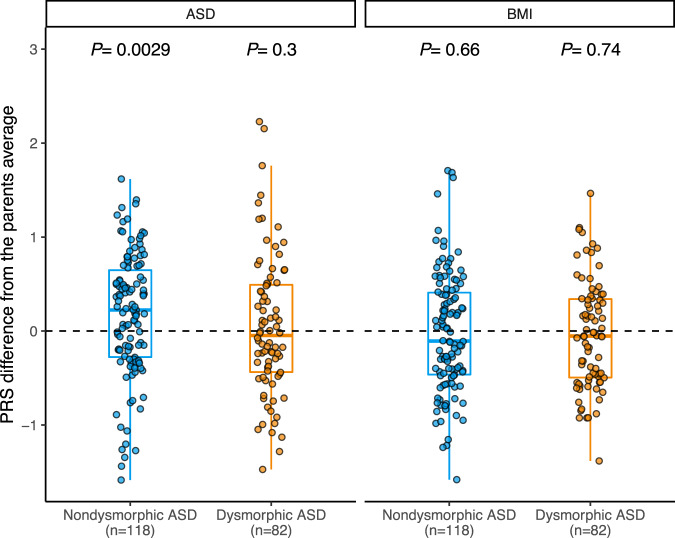
Fig. 4. Inheritance of polygenic risk for ASD and BMI in morphologic subtypes.
Differences in polygenic risk score (PRS) for ASD and BMI between participants and their respective mid-parent score. Box plots depict the median and quartiles of polygenic transmission disequilibrium test (pTDT) deviation, and the minima and maxima of box plots indicate 3× the interquartile range-deviated pTDT deviations from the median. Dots represent pTDT deviations of participants. P values for each subgroup indicate the probability that the mean of the pTDT deviation distribution is not greater than zero (one-sided Welch’s t-test was performed assuming pTDT deviation to be greater than zero), as depicted by the dotted line. Source data are provided as a Source Data file.

