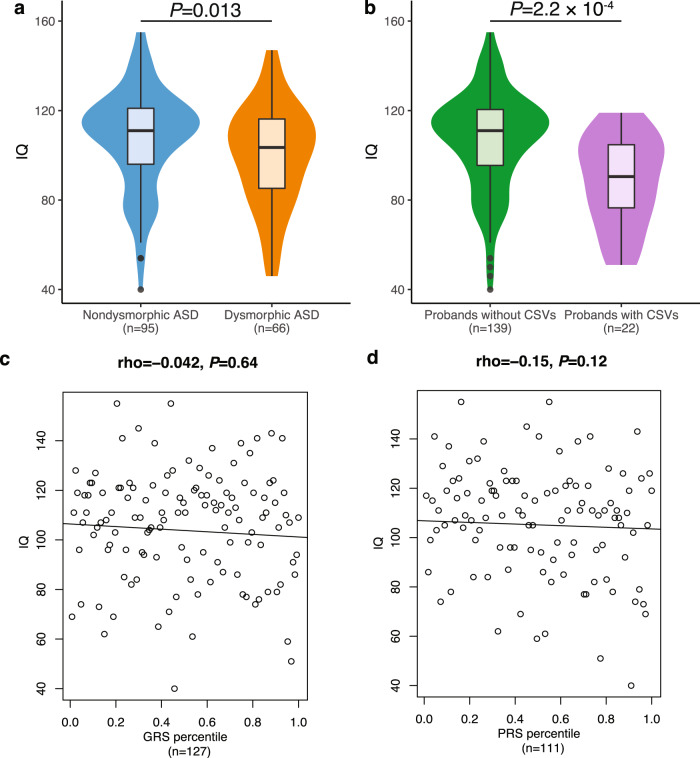
Fig. 5. Relationship between IQ, morphological ASD subtypes and genetic variants.
a Comparison of IQ among morphological ASD subtypes. b Comparison of IQ between probands with and without a CSV. a, b Violin plots show the distributions of the probands’ IQ; box plots contained within show the median and quartiles of IQ for each subtype, the minima and maxima of box plots indicate 3× the interquartile range-deviated IQ from the median. P values denote the probability that the mean IQ of nondysmorphic ASD or probands without CSVs is not greater than dysmorphic ASD or probands with CSVs, respectively (one-sided, Welch’s t-test). Correlation between IQ and (c) GRVS and (d) PRS is shown. c, d Each dot represents the IQ and GRVS or PRS percentile of a sample. The linear regression line indicates the linear correlation between IQ and GRVS or PRS percentiles. Correlation coefficient is quantified by two-sided Spearman’s rho correlation. P values indicate the probability that the correlation is occurred due to chance. Source data are provided as a Source Data file.

