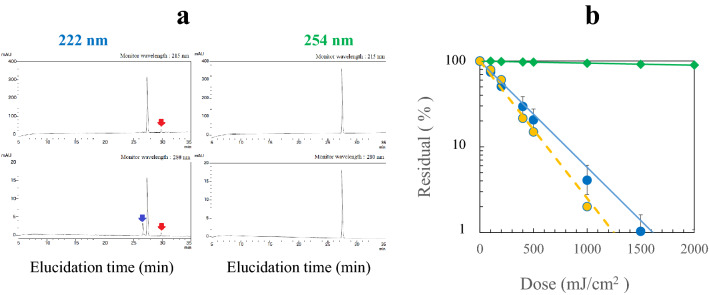
Figure 4.
(a) HPLC elucidation profiles after UV irradiation of angiotensin II with a dose of 100 mJ/cm2 at 222 and at 254 nm. The monitoring wavelengths are (upper) 215 nm, and (lower) 280 nm. The red arrows indicate the photoproduct assingned to a peptide containing tyrosine, and the blue one to a peptide containing the product from photodegradation of histidine. (b) reduction of angiotensin II by UV irradiation. (Blue circle) 222 nm and (green diamond) 254 nm with aq. solutions aerated, (yellow circle) 222 nm with aq. solutions deaerated. n = 3.

