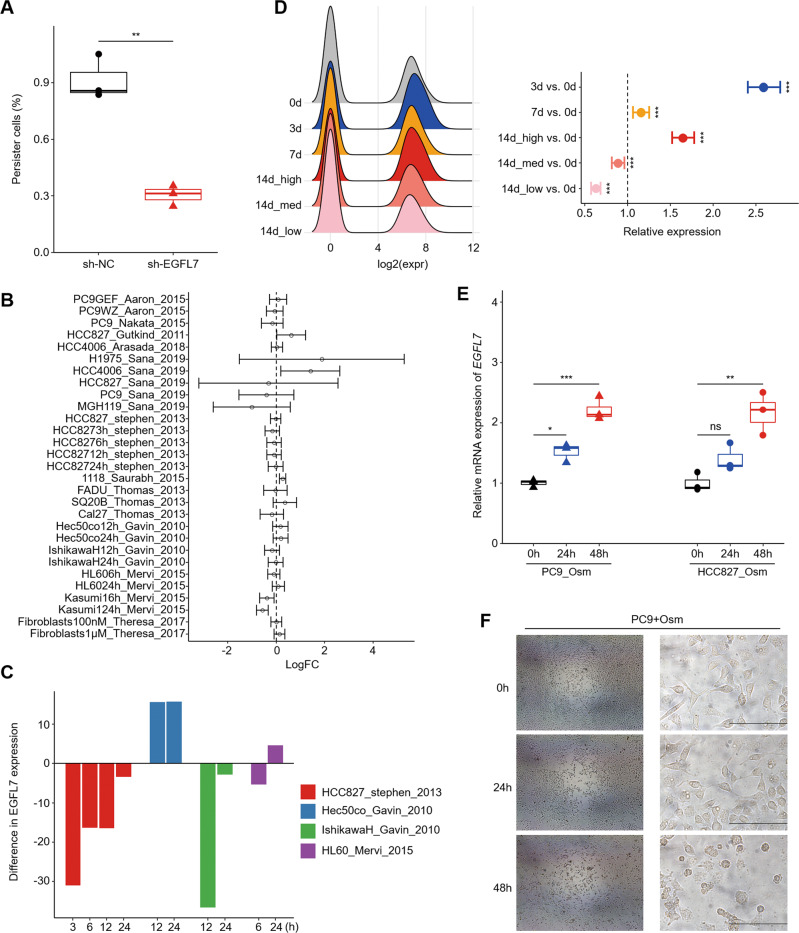
Fig. 3. Validation of EGFL7 as a late response gene to EGFR kinase inhibition.
A The proportion of PC9 cells remained after a 9-day osimertinib treatment to seeding number. The median line represents median values. The top and bottom of box are 25th and 75th percentiles. B Relative expression of EGFL7 in cancer cells treated with EGFR inhibitors to the control in indicated studies. Dashed line presents no change (fold change equal to 1). Point and error bars present mean value and 95% confidence interval (see methods). C Difference in EGFL7 expression upon different treatment duration of EGFR inhibitors in the indicated datasets from B. D Relative EGFL7 expression in groups of PC9 single cells (GSE150949, see methods). Dashed line presenting no change (fold change equal to 1) in right panel. E Relative EGFL7 expression in PC9 and HCC827 cells treated with osimertinib for the indicated time duration. Point and error bars present mean value and 95% confidence interval in D and mean ± standard error of the mean (SEM) in E. p values are calculated by MAST package (D). F Representative light microscopic images of PC9 upon different osimertinib treatment duration. Scale bar: 200 µm. p values are calculated by two-tailed Student’s t test (ns, p > 0.05; *p < 0.05; **p < 0.01; ***p < 0.001) otherwise specified.

