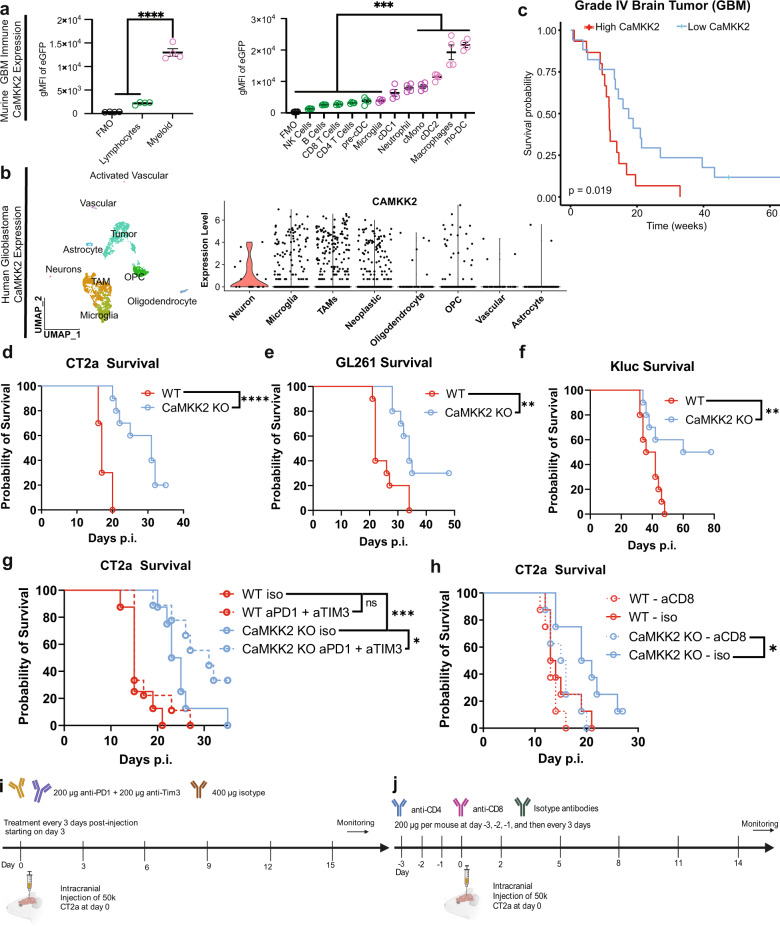
Fig. 1. CaMKK2 expression within the GBM TME is associated with poor survival and resistance to ICB.
a Tumor-bearing hemispheres were harvested from WT (FMO) or CaMKK2-EGFP mice on D14 and stained with a multi-color flow panel to resolve major immune populations. n = 4 mice per genotype, one-way ANOVA p < 0.05 with unadjusted post hoc two-tail Fisher LSD t-test. Data are presented as mean ± SEM. ****p < 0.0001, ***p = 0.0004. b UMAP plot of Human Glioblastoma tumor microenvironment, and Violin plot of CaMKK2 expression in corresponding cell types. Data pulled from http://gbmseq.org/ and re-analyzed. c Glioblastoma survival stratified by median Log2(CaMKK2) expression where above median expression was considered “High” and below “Low”. High n = 15, low n = 17, Log-rank test. d–f Mice were intracranially implanted with 50k CT2a, 100k GL261, or 50k Kluc and monitored for survival. n = 10 per group, Log-rank test. d ****p < 0.0001. e **p = 0.0027. f **p = 0.0086. g 50k CT2a was implanted intracranially and either 400 ug isotype or a combination therapy of 200 ug aPD1 and 200 ug aTIM3 was administered on D3 p.i and every 3 days through D15 for a total of 5 treatments. n = 9 for ICB treated groups and n = 8 for isotype treated groups, Log-rank test. ***p = 0.0001, *p = 0.0416. h 50k CT2a was implanted intracranially and mice were monitored for survival. Either 200 ug of isotype, aCD4 or aCD8 was administered on D-3,D-2,D-1, p.i. and every 3 days after through D14 for a total of 8 treatments. n = 8 per group, Log-rank test. *p = 0.0279. i Schematic depicting ICB treatment strategy. j Schematic depicting CD4 and CD8 depletion strategy. i, j Graphics were created with BioRender.com. Source data are provided as a Source Data file.

