Fig. 4.
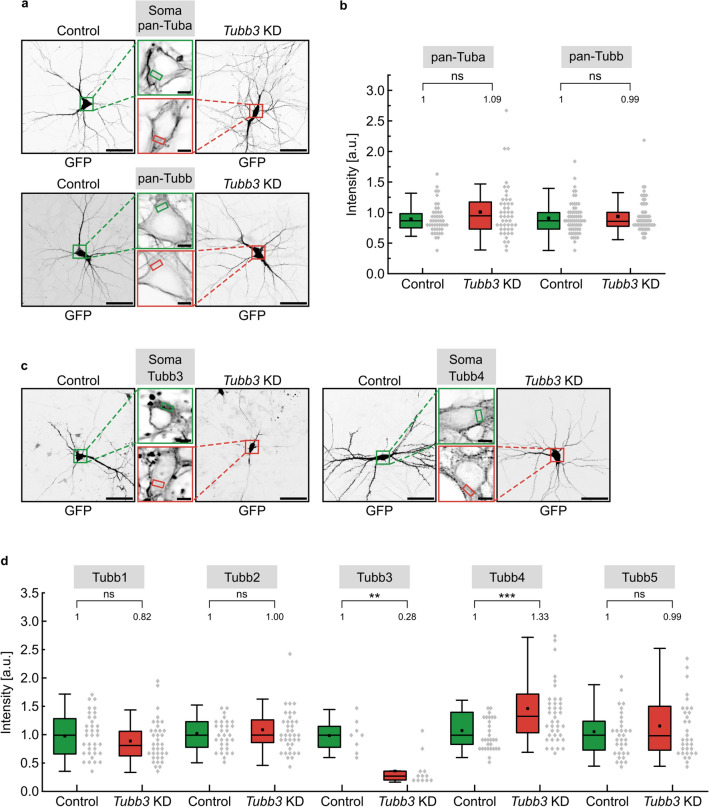
Upregulation of Tubb4 gene expression following Tubb3 knockdown. a Cultured hippocampal neurons (DIV12) transfected with control or Tubb3 knockdown constructs. Upper: Detection with a pan-alpha antibody to probe for total-tubulin. Lower: Detection with a pan-beta tubulin antibody. Scale bar, 50 µm. Middle panels: Enlargements of cell somata boxed regions. Tubulin intensities were measured inside the soma, indicated by the small colored boxes. DAPI staining of the nucleus (not shown) was used to verify that Tubb3 intensity measurements were performed in the cytoplasm. Scale bar, 5 µm. b Quantification of a, depicting median values (N = 3 experiments). The intensity levels of pan-Tuba and pan-Tubb show no significant (n.s.) decrease, following transfection of Tubb3 KD construct, as compared to control, set to 1. Each data point in the graph represents one cell (panTuba: Control (n = 46), Tubb3 KD (n = 47). panTubb: Control (n = 64), Tubb3 KD (n = 60). For graphical representation, data were binned with a bin size of 0.08 a.u. Statistics: Mann–Whitney Rank Sum Test. c Cultured hippocampal neurons (DIV12) transfected with control or Tubb3 knockdown constructs. Left: Detection with a specific Tubb3 antibody. Right: Detection with a specific Tubb4 antibody. Scale bar, 50 µm. Middle panels: Enlargements of cell somata boxed regions. Tubulin intensities were measured inside the soma, indicated by the small colored boxes. DAPI staining of the nucleus (not shown) was used to verify that tubulin intensity measurements were performed in the cytoplasm. Scale bar, 5 µm. d Quantification of c and data shown in Figure S7, depicting median values (N = 3 experiments). **p < 0.01, ***p < 0.001, ns not significant. Each data point in the graph represents one cell. Tubb1: Control (n = 35), Tubb3 KD (n = 36), Tubb2: Control (n = 31), Tubb3 KD (n = 37), Tubb3: Control (n = 8), Tubb3 KD (n = 12), Tubb4: Control (n = 30), Tubb3 KD (n = 39), Tubb5: Control (n = 33), Tubb3 KD (n = 33). For graphical representation, data were binned with a bin size of 0.08 a.u. Statistics: Mann–Whitney Rank Sum Test

