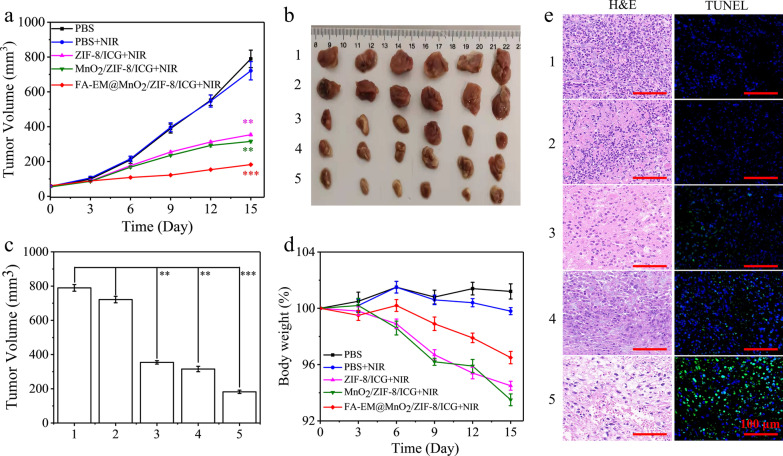
Fig. 7.
a The tumor volumes in six different groups after treatment. b Photographs of the tumors on day 15 post-injection, and c Mean tumor weights on day 15 after the last treatment of PBS (1), PBS + NIR (2), ZIF-8/ICG + NIR (3), MnO2/ZIF-8/ICG + NIR (4), FA-EM@MnO2/ZIF-8/ICG + NIR (5). d Body weight of mice in different groups during treatment. e H&E (left) and TUNEL staining (right) of tumor slices collected from 4T1 tumor-bearing mice after treatment of PBS (1), PBS + NIR (2), ZIF-8/ICG + NIR (3), MnO2/ZIF-8/ICG + NIR (4), FA-EM@MnO2/ZIF-8/ICG + NIR (5). Scale bars: 100 μm. Significant differences (*: p < 0.05; **: p < 0.01; ***: p < 0.001) among different groups are shown

