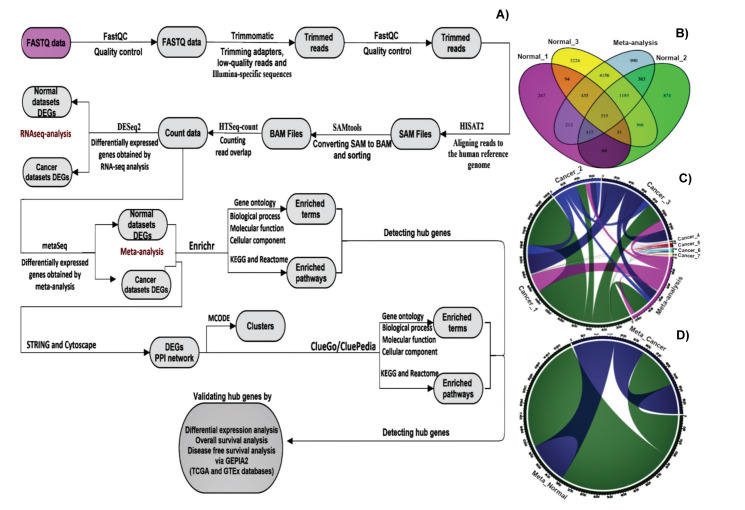
Figure 1.
A) Workflow of the current study. Various comparisons of common and different DEGs among different groups are summarized for normal cell lines by Venn diagram, in B), and cancer cell lines by chord diagram in C), D) Chord diagram illustrates common and different DEGs between two meta-analyses.

