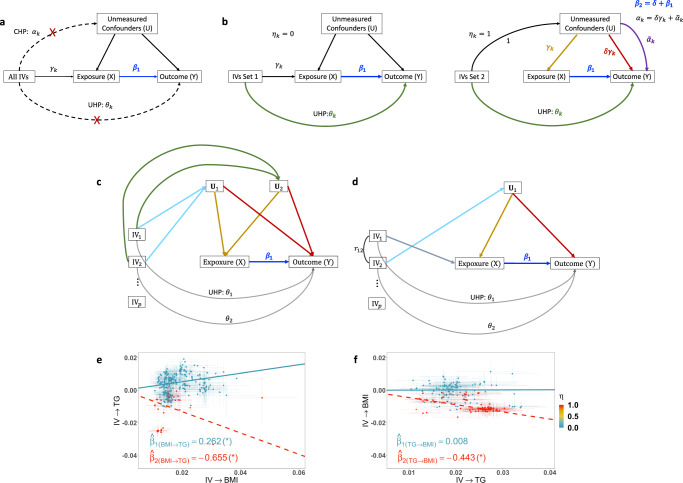
Fig. 1. Causal diagrams of classic MR and MR-CUE models, with an illustrative example.
a The causal diagram of classic MR models. Classic MR models assume that IVs affect outcome through only exposure. b An illustration of the MR-CUE model. MR-CUE decomposes IVs into two sets, those not affected by CHP (left, ηk = 0) and those affected by CHP (right, ηk = 1). MR-CUE allows all IVs to have potential non-zero UHP effect, θk. In b right panel, we assume that the IV affects the exposure and confounder proportionally, with a sum of IV-to-exposure effect of γk. We rescale the IV-to-confounder effect to be 1 and the effect of confounders on exposure is then γk (yellow line). The red line represents the decomposed and projected confounder-to-outcome effect and is also proportional to IV-strength, γk. The IV-specific perturbation of confounders may induce an IV-specific bias, , which has a mean of zero. c, d Illustrations of two scenarios when IV-specific CHP effects may arise: c there are two or more confounders; d there is a single confounder but IVs with different mechanisms are correlated with each other. e An illustrative example of estimating the causal effect of BMI on TG in the presence of CHP. f The reverse causation estimation of TG on BMI confounded by CHP. When estimating the effect of BMI on TG, some IVs (red) are affected by CHP. Adjusting those IVs would lead to a significant effect estimate of BMI on TG, , and an insignificant reverse causal effect estimate from TG to BMI, . In this example, CHP would induce IV-associated confounders and introduce a significant and negative bias. Using estimated IVs with CHP, one may obtain significant causal and reverse causal effect estimates, , and .

