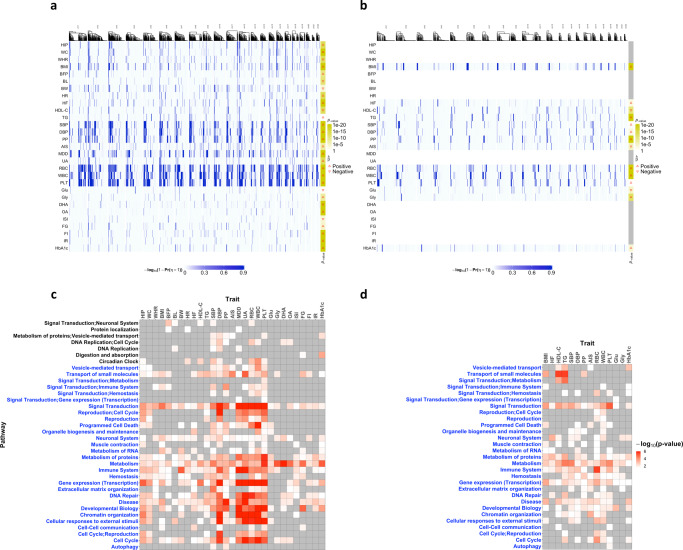
Fig. 4. MR-CUE analysis of exposure-T2D trait pairs.
a, b The heatmaps of the estimated strengths of CHP, , for selected IVs across all chromosomes for 29 and 14 exposures for T2D in the European and East Asian populations, respectively. The p-values are calculated based on two-sided MR-CUE tests without multiple testing adjustment. c, d The heatmaps of enriched pathways for identified IVs with CHP by exposure in the European and East Asian populations, respectively. The p-values are calculated based on one-sided Fisher‘s exact tests without multiple testing adjustment. The blue y-axis in c, d represent the common pathways of European and East Asian populations.

