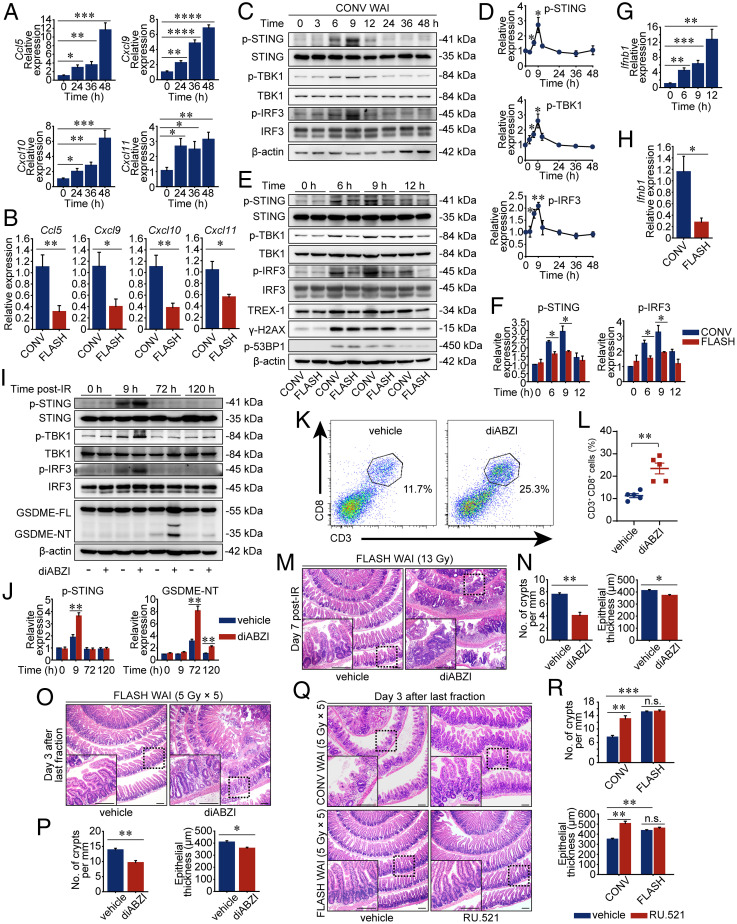
Fig. 3.
FLASH X-ray elicits less cGAS-STING activation in the intestinal crypts. (A) PD-L1 KO mice were exposed to 13-Gy CONV WAI. The relative mRNA expression levels of Ccl5, Cxcl9, Cxcl10, and Cxcl11 from the intestinal crypts were determined by qRT-PCR (n = 5 mice per group). (B) The relative mRNA expression levels from the intestinal crypts were determined by qRT-PCR at 48 h after 13-Gy CONV or FLASH irradiation (n = 5 mice per group). (C and D) Western blot analysis of protein expression levels in the intestinal crypts of PD-L1 KO mice at the indicated time after 13-Gy CONV WAI. Representative immunoblot pictures are shown (C). The relative ratio of phosphorylated STING, phosphorylated TBK1, and phosphorylated IRF3 to β-actin was determined from the immunoblot quantification and was normalized to the control group (D). (E and F) Immunoblot analysis of protein expression levels in the intestinal crypts of PD-L1 KO mice at the indicated time after 13-Gy CONV or FLASH WAI. Representative immunoblot pictures are shown (E). The relative ratio of phosphorylated STING and phosphorylated IRF3 to β-actin was determined from the immunoblot quantification and was normalized to the “CONV 0 h” group (F). (G) PD-L1 KO mice were exposed to 13-Gy CONV WAI. The relative mRNA expression levels of Ifnb1 from the intestinal crypts were determined by qRT-PCR (n = 5 mice per group). (H) The relative mRNA expression levels from the intestinal crypts were determined at 12 h after 13-Gy CONV or FLASH irradiation (n = 5 mice per group). (I–N) PD-L1–deficient mice were exposed to 13-Gy FLASH WAI and were treated with solvent or STING agonist, diABZI, immediately after irradiation. Representative pictures of the immunoblot analysis of protein expression levels in the intestinal crypts at the indicated time post-IR are shown (I). The relative ratio of indicated protein to β-actin was determined from the immunoblot quantification and was normalized to the “vehicle 0 h” group (J). Crypt-infiltrated CD3+CD8+ cells of mice at 3 d after WAI were determined by flow cytometric analysis (K), and data are presented as quantified percentages (L) (n = 5 mice per group). Representative pictures of H&E-stained sections of proximal intestines sampled at 7 d after FLASH WAI are shown (M), and the numbers of crypts per millimeter and epithelial thickness were quantified (N) (n = 3 mice per group). (O and P) C57BL/6 mice were exposed to fractionated FLASH WAI and were dosed with the intraperitoneal injections of diABZI and anti-mouse PD-L1 antibody as described in Materials and Methods. Representative pictures of H&E-stained sections of proximal intestines sampled on day 3 after the last fraction are shown (O), and the numbers of crypts per millimeter and epithelial thickness were quantified (P) (n = 3 mice per group). (Q and R) C57BL/6 mice were exposed to fractionated CONV or FLASH WAI and were dosed with the intraperitoneal injections of RU.521 and anti-mouse PD-L1 antibody as described in Materials and Methods. Representative pictures of H&E-stained sections of proximal intestines sampled on day 3 after the last fraction are shown (Q), and the numbers of crypts per millimeter and epithelial thickness were quantified (R) (n = 3 mice per group). Data are pooled from three (A–J) or two (K and L) independent experiments or represent three independent experiments (M–R). Error bars indicate SEM. *P < 0.05, **P < 0.01, ***P < 0.001, ****P < 0.0001, and n.s. were determined by a two-sided Student’s t test. (Scale bars, 200 μm.)

