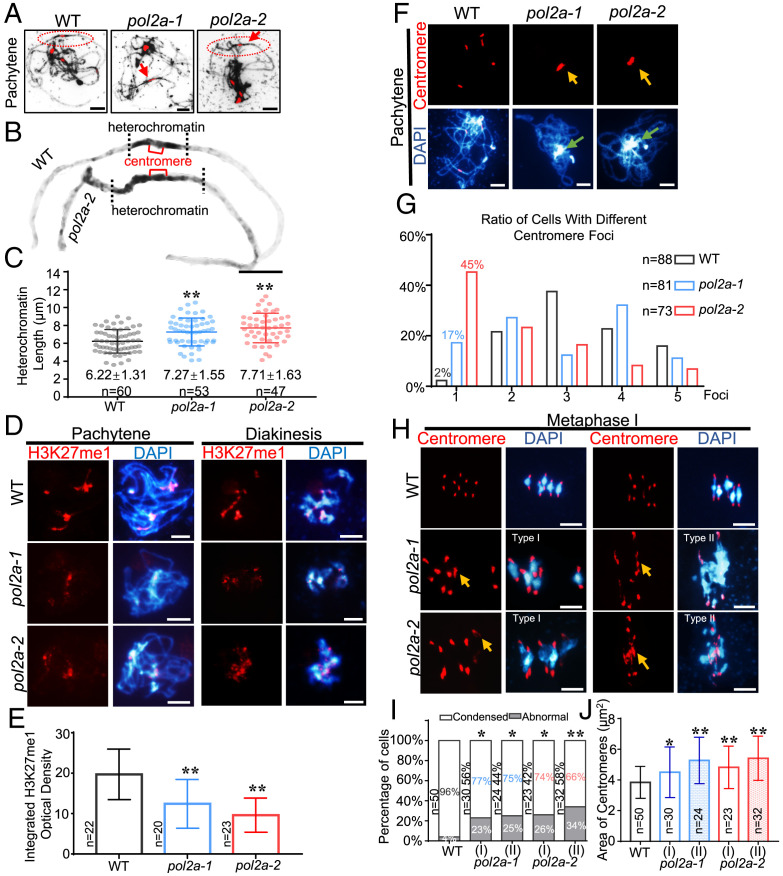
Fig. 1.
pol2a has defective meiotic heterochromatin condensation. (A) Chromosome morphology with centromere FISH of WT, pol2a-1, and pol2a-2 at pachytene. Red arrows indicate longer heterochromatin than WT. (B) Enlarged images of chromosomes from A marked by red ellipses show abnormal pericentromeric/centromeric heterochromatin in pol2a compared to WT. (C) The average length of pachytene heterochromatin in WT (gray), pol2a-1 (blue), and pol2a-2 (red). (D) Immunofluorescence of H3K27me1 in WT, pol2a-1, and pol2a-2 chromosome spreads at pachytene and diakinesis. (E) Histogram showing the integrated density of H3K27me1 at pachytene. (F) Chromosome and centromere phenotypes of WT, pol2a-1, and pol2a-2 at pachytene. Yellow arrows indicate the enlarged and associated centromere signals. Green arrows indicate the abnormal association of heterochromatin of nonhomologs. Error bars indicate the standard deviations of the samples. (G) Percentage of cells in WT, pol2a-1, and pol2a-2 with different numbers of centromere foci at pachytene. (H) Chromosome and centromere phenotypes at metaphase I by FISH. Type I spreads five bivalents with enlarged centromeres; type II has multivalents (three or more associated chromosomes) with abnormal centromere associations. Yellow arrows indicate the enlarged and associated centromere signals. (I) Percentage of cells showing type I (five bivalents) and II (multivalents) with abnormal centromeres in pol2a-1 and pol2a-2 (Fisher’s exact test). The ratios near the bar indicate the percentage of type I or II in pol2a mutants. Cells with centromeric areas larger than 1.5 × 3.8 μm2 (the average area of centromere fluorescence in WT is 3.8 μm2) were defined as “Abnormal.” (J) Centromere signal area at metaphase I. Error bars indicate the standard deviations of the samples. *, P < 0.05; **, P < 0.01; two-tailed Student's t test. Scale bars, 5 μm.

