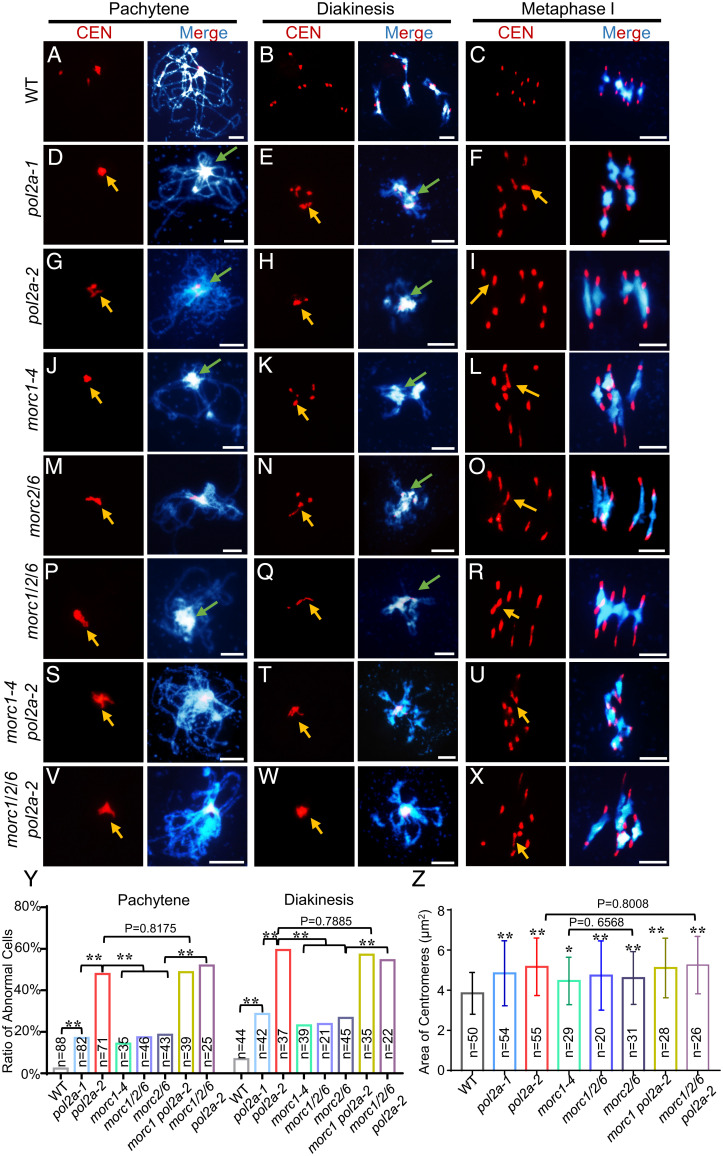
Fig. 3.
The meiotic centromere phenotypes of morc mutants are similar to pol2a. (A–X) Chromosome and centromere phenotypes of WT, po12a-1, pol2a-2, morc1-4, morc2/6, morc1/2/6, morc1-4 pol2a-2, and morc1/2/6 pol2a-2 at pachytene, diakinesis, and metaphase I by centromere (CEN) FISH. Yellow arrows indicate clustered and associated centromere signals. Green arrows indicate the abnormal association of heterochromatin of nonhomologs. Scale bars, 5 μm. (Y) Histogram showing the ratio of cells with centromere defects from WT and mutants at pachytene and diakinesis, respectively (Fisher’s exact test). (Z) Area of centromere signals at metaphase I in each mutant (two-tailed Student’s t test). P values refer to the comparison between WT and mutants unless specified. Error bars indicate the standard deviations of the samples. *, P < 0.05; **, P < 0 0.01.

