Fig. 1.
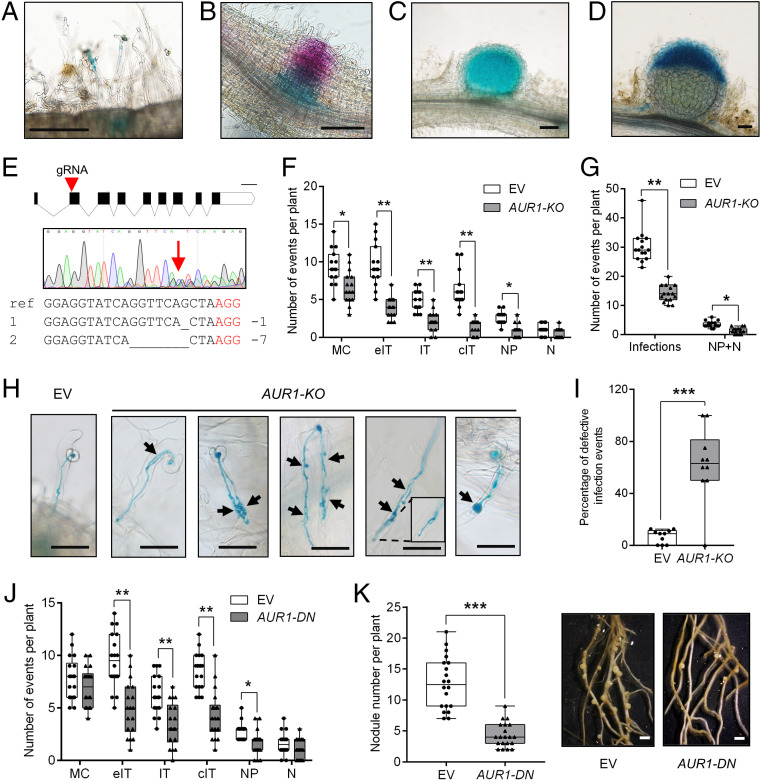
AUR1 contributes to rhizobial infection and nodulation. (A–D) Images showing AUR1pro:GUS activity in rhizobia-infected root hairs and the underlying cortical cells (A), in a nodule primordium (B), in a young nodule (C), and in an elongated nodule at 5 dpi (D). The blue color indicates GUS staining, and the magenta color in B indicates LacZ staining of S. meliloti Rm2011. Scale bars, 200 μm. (E) CRISPR/Cas9 mediated tissue-specific KO of AUR1 (AUR1-KO, ChOMT3pro:Cas9) in hairy roots. The guide RNA target position in AUR1 exons is indicated by the red triangle. Sequences having multiple peaks around the guide-RNA target are indicated by the red arrow, which suggests gene editing. The wild-type sequence (ref) at the targeting site and two primary edited forms are aligned where the deleted bases are indicated by underscores, and the red letters indicate the protospacer-adjacent motif (PAM) site. Scale bar, 200 bp. (F) Quantification of infection events at different developmental stages (including both normal and aberrant infections) and nodules/nodule primordia in the empty vector (EV) and tissue-specific AUR1-KO at 5 dpi. Infection-event categories are described in detail in (SI Appendix, Fig. S2A). MC, rhizobia microcolony; eIT, elongating infection-thread in root hair; IT, infection thread that fully traversed the root hair; cIT, infection thread that traversed the root hair and ramified into the underlying cortical cell; NP, nodule primordium; N, nodule. (G) Quantification of total infection events and nodules/nodule primordia from (F). (H) Representative infection phenotypes of tissue-specific KO of AUR1 at 5 dpi. Black arrowheads indicate defective infection threads. Scale bars, 50 μm. (I) Quantification of defective infection events in the EV control and tissue-specific AUR1-KO plants. (J) Root hair–infection phenotypes of tissue-specific expression of AUR1-DN (ChOMT3pro:AUR1-DN) at 7 dpi. (K) Nodulation phenotypes of tissue-specific expression of AUR1-DN at 14 dpi. Representative hairy roots expressing EV or AUR1-DN are shown on the Right. Scale bars, 1 mm. Means were compared using Student’s t test. *P < 0.05, **P < 0.01, ***P < 0.001. Boxes show the first quartile, median, and third quartile; whiskers show minimum and maximum values; dots show data points. Experiments were carried out two (J and K) or three times (A–I) with similar results.

