Fig. 4.
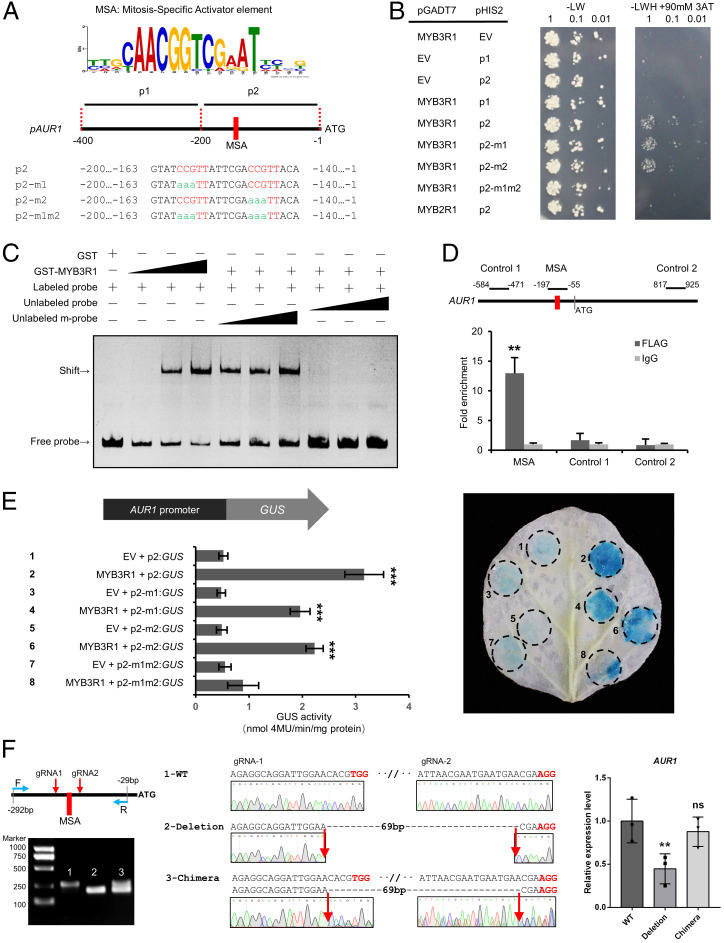
MYB3R1 directly activates the expression of AUR1. (A) Analysis of AUR1 promoters from 20 plant species conducted using MEME revealed consensus sites containing an MSA element (CCGTT/AACGG). Diagram of the M. truncatula AUR1 promoter sequences; these were used for further assays (B and E). (B) Interaction of MYB3R1 with the AUR1 promoter revealed by a Y1H assay. The AUR1 promoter sequence (refer to A) was used as bait (pHIS2) and MYB3R1 was used as a prey (pGADT7). Yeast cells were plated onto selection medium without Trp/Leu. In the absence of activation, the leaky expression of HIS was controlled by adding 90 mM 3-amino-1,2,4-triazole (3AT) to the selection medium without Trp/Leu/His. The combinations of MYB3R1 and versions of the AUR1 promoter are indicated alongside the yeast colonies. (C) Recombinant GST-MYB3R1 protein binds the AUR1 promoter in vitro. The probes covering the regions 197- and 90-bp upstream of the AUR1 coding sequence were incubated with increasing amounts of GST-tagged MYB3R1 fragment containing the DNA binding domain (0, 0.1, 0.3, and 0.9 μg); the corresponding EMSA results are shown in the first four lanes. Competition of GST-MYB3R1 binding with the unlabeled wild-type (WT) or mutant probes (both MSAs were mutated) are shown in the last six lanes, and this assay was performed with 0.3 μg of protein and 20-, 50-, and 100-fold excess amounts of unlabeled WT or mutant probe. A band shift indicates positive probe binding. (D) ChIP-qPCR analysis of MYB3R1 binding to the AUR1 promoter in M. truncatula. qPCR was performed using primers surrounding the MSAs or control region not containing the MSAs (Control 1/2). (E) Transactivation assays of the 200-bp AUR1pro:GUS reporter and MYB3R1 in N. benthamiana leaves. GUS expression driven by different AUR1 promoters (refer to A) coinfiltrated with MYB3R1. GUS activity was expressed in nmol 4-methylumbliferone min−1 mg−1 protein. Representative GUS staining is shown in the Right panel. (F) Relative expression (qRT-PCR) of AUR1 in M. truncatula hairy roots transformed with a CRISPR construct with two guide RNAs (gRNAs) flanking the MSA elements. WT indicates the roots were not edited (control band, 264 bp); Deletion indicates roots with biallelic mutations (195 bp); Chimera indicates the roots are not biallelic mutations (two bands). Expression levels were normalized against MtEF1, and data are reported as mean ± SD using three independent biological repeats. Means were compared using Student’s t test. **P < 0.01, ***P < 0.001. Experiments were carried out two (D–F) or three times (B and C) with similar results. EV, empty vector; ns, not significant.

