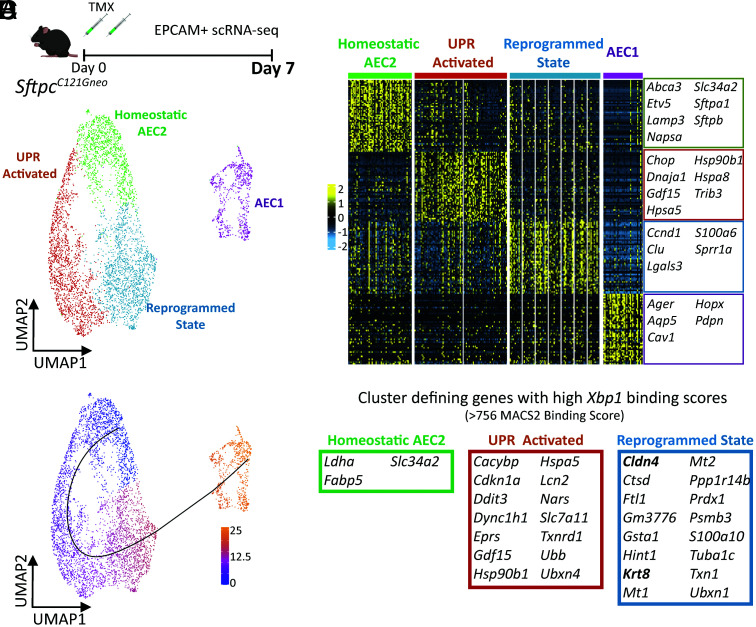
Fig. 5.
Alveolar epithelial cell analysis identifies trajectory from homeostasis to a reprogrammed state enriched in Xbp1 target genes. (A) Schematic (Top) for scRNA-seq of EPCAM+ sorted cells from SftpcC121G 7 d following and (Bottom) UMAP projection of alveolar epithelial cells (AEC2 states plus AEC1 cells). (B) Heatmap of the top 50 cluster-defining genes by FDR for the four alveolar epithelial cell clusters annotated with marker genes of each AEC2 state at AEC1 cells. (C) Trajectory analysis of the alveolar epithelium results in one putative lineage relationship; color represents cell localization along pseudotime. (D) Analysis of published mouse ChIP-seq dataset for XBP-1 binding domains reveals 14 and 16 genes with high binding scores (genes within top quartile for MACS2 binding score) within the top 50 cluster-defining genes for the UPR-activated and reprogrammed state clusters, respectively, compared with three genes with high XBP-1 binding scores in the homeostatic AEC2 cluster.

