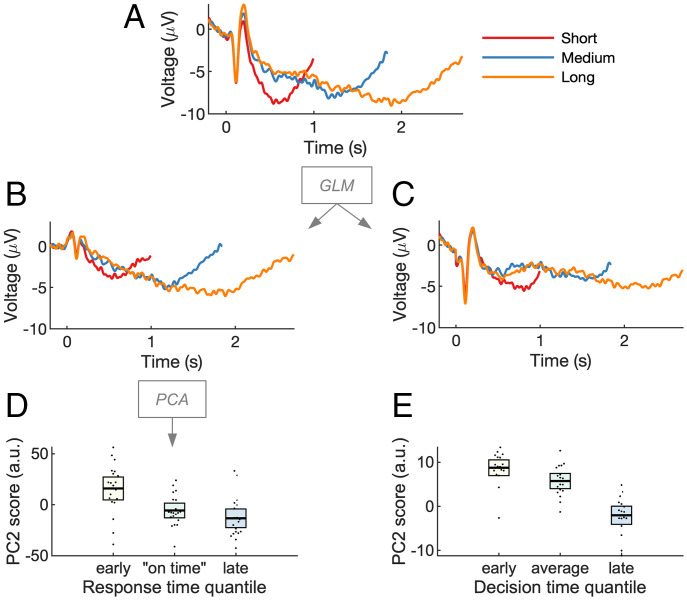
Fig. 5.
Variation in scaled-time components predicts behavioral variation in time estimation. (A) Cue-locked EEG, shown as ERPs, was analyzed via GLM. (B and C) To visualize the unmixing of scaled-time and fixed-time components, the residual (noise) was recombined with either the scaled-time component (B) or the fixed-time components (C). PCA was run on the “scaled time plus residual” EEG. The second principal component resembled the temporal derivative or “rate” of the scaled component (SI Appendix, Fig. 5). (D) PC2 scores depended on response time, implying the scaled-time component peaked earlier for fast responses and later for slow responses. (E) The effect replicated in a decision-making task. PC2 scores are in arbitrary units (a.u.). Error bars represent 95% CIs.

