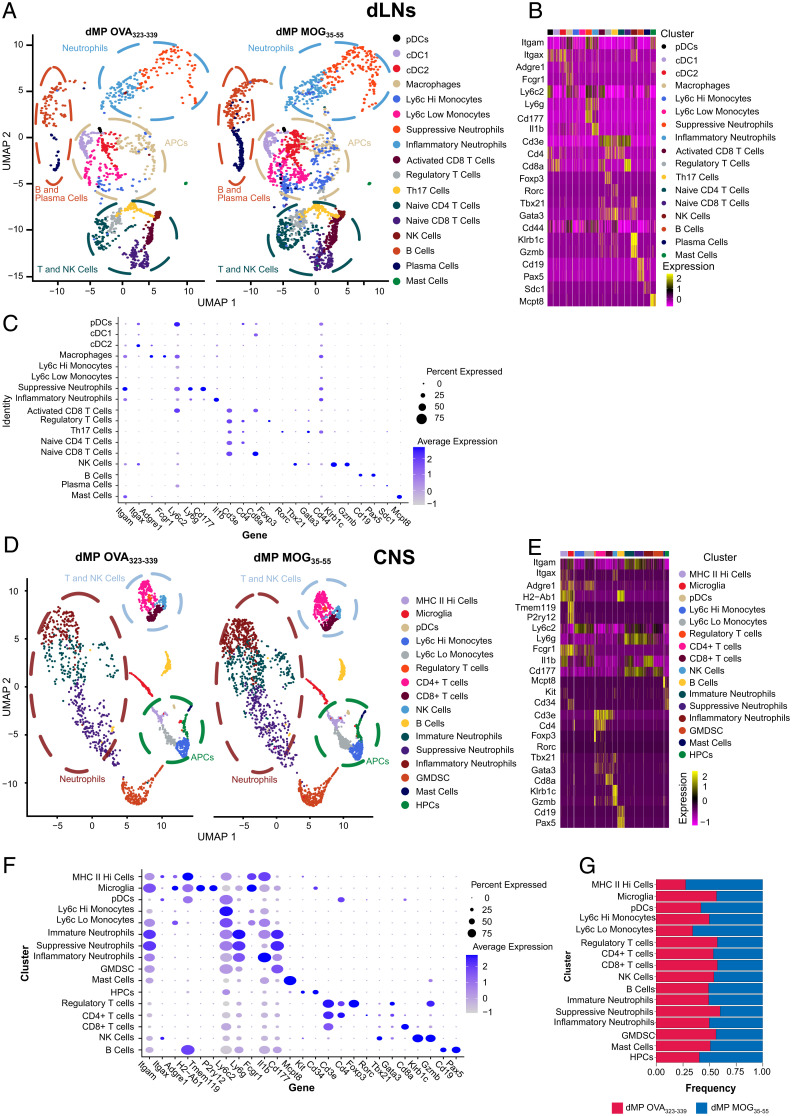
Fig. 3.
dLNs and CNS scRNAseq cluster identification in mice with advanced EAE treated with dMP MOG versus dMP OVA subcutaneously. (A) Side-by-side uMAP plot showing clusters in dLNs of dMP OVA and dMP MOG spinal cord on day 2. Each dot represents an individual cell where ∼10,000 cells were analyzed per group with plots down-sampled to present more distinct clusters. Circles highlight the location of distinct cell types including cDC1s, cDC2s, neutrophils, T cells, and natural killer (NK) cells. Clustering utilized Seurat for initial clustering and then hallmark genes to remove nonbiologically relevant clusters. (B, C) Hallmark genes used to identify each cluster. (D) Side-by-side uMAP plot showing clusters in dMP OVA and dMP MOG spinal cord. Cells were collected from one mouse in each treatment group on day 7 at a score of 3 (Fig. 1B). Each dot represents an individual cell where ∼10,000 cells were analyzed per group with plots down-sampled to clusters more distinctly. Circles highlight the location of distinct cell types including MHC IIhigh cells, microglia, neutrophils and T cells, and NK cells. Clustering utilized Seurat for initial clustering and then hallmark genes to remove over clustering. (E, F) Hallmark genes used to identify each cluster. (G) Fractions of each cluster following post–sort recombination as a comparison between dMP OVA and dMP MOG35–55. GenesI are grouped to form a diagonal of cell type and hallmark genes on the dot plot. GMDSC, granulocytic myeloid derived suppressor cells; HPC, hematopoietic precursor cells.

