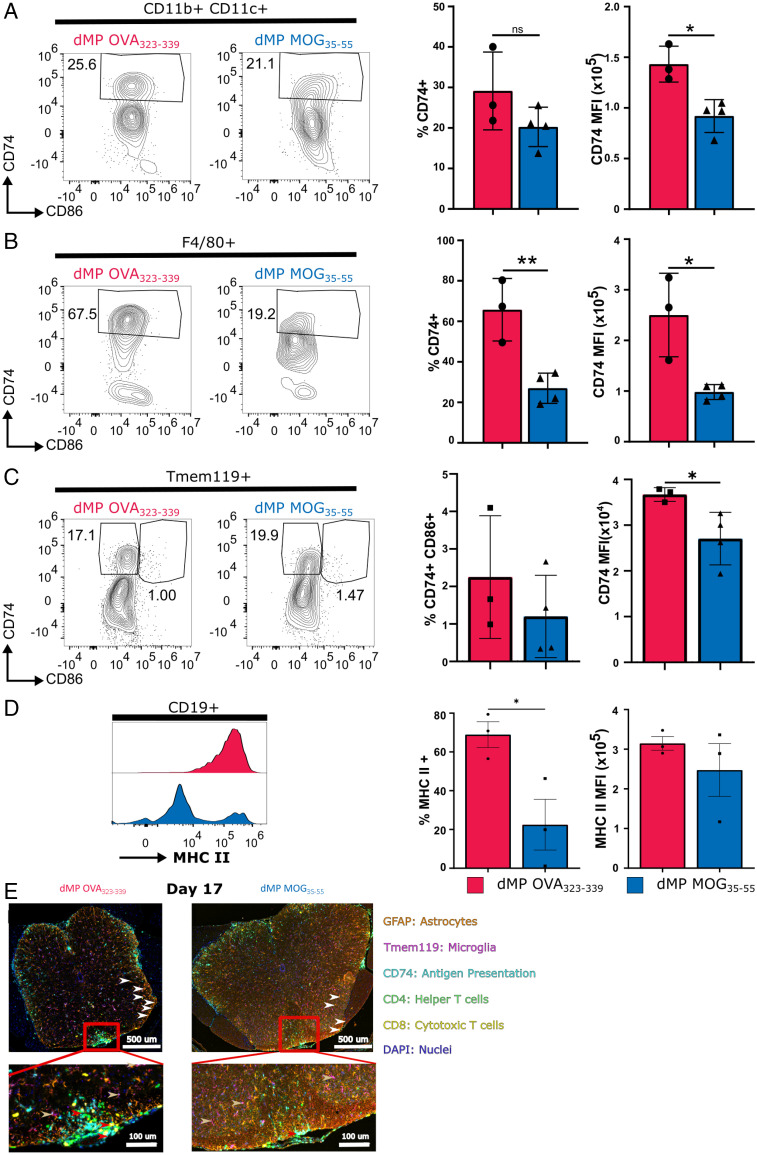
Fig. 5.
dMP MOG treatment in mice with advanced EAE results in reduction in MHCII components in microglia and CNS DCs, macrophages, and B cells. Representative flow plots and quantification of CD74 in the spinal cord on day 7 in (A) DCs, (B) macrophages, and (C) microglia. (D) Representative flow cytometry plots and quantification of MHC II expression by B cells on day 7. (E) Multiplex immunofluorescence image of the lumbar spinal cord on day 17. Markers are as follows: CD4 (T helper cells) in green, CD8 (cytotoxic T cells) in yellow, CD74 (MHC II chaperone protein) in cyan, Ki67 (proliferation marker) in red, GFAP (astrocytes) in orange, and Tmem119 (microglia) in magenta. Red arrows show APCs interacting with T cells, white arrows point to astrocytes, and gold arrows point to microglia. The dorsal column in the red box is magnified in the Bottom image. All populations were pregated on live CD45+ DCs and macrophages. B cells were negative for Tmem119 and CD3e. Macrophages and DCs were negative for B220/CD19, and macrophages were negative for CD11c. n = 3 to 4/group; *P < 0.05; ** P < 0.01.

