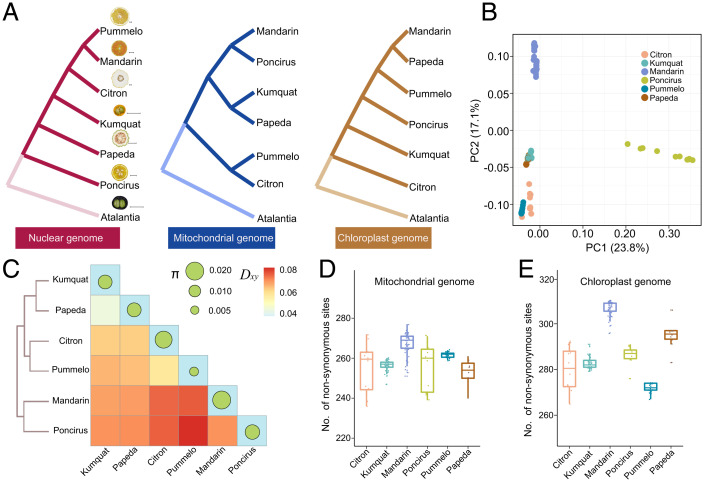
Fig. 2.
Nonsynchronous genetic divergence of mitochondrial genomes in mandarin during citrus evolution. (A) Consensus phylogeny of nuclear genomes (Left), mitochondrial genomes (Middle), and chloroplast genomes (Right) from seven species of citrus. The phylogenetic diagram was constructed from the population dataset. The atalantia population (Atalantia buxifolia) was used as an outgroup. Scale bar, 2 cm. (B) PCA of mitochondrial genomes from six populations of citrus. The outgroup was excluded. PC1 (23.8%) and PC2 (17.1%) are shown. (C) Divergence (Dxy) and genetic diversity (π) analysis of mitochondrial genomes from six species of citrus. The size of the circle is proportional to the genetic diversity. The amount of divergence is indicated with a heatmap. (D and E) Evaluation of genetic load in mitochondrial and chloroplast genomes. The number of nonsynonymous mutations in predicted ORFs from six species is indicated on the y-axis.

