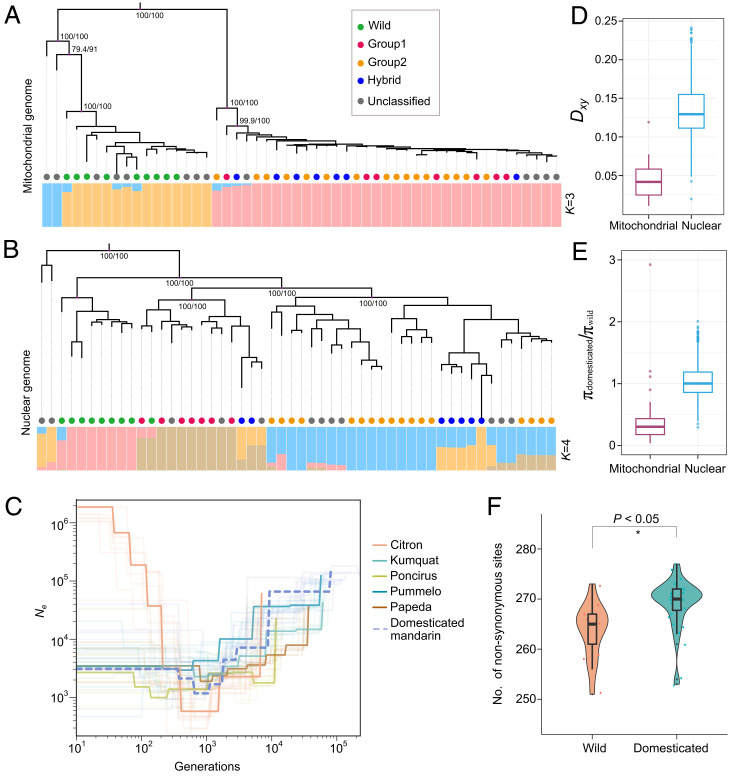
Fig. 3.
Domestication history of mandarin inferred from mitochondrial genomes. (A) Population structure analysis based on the mitochondrial genomic dataset. The colored circles represent the classification of mandarin and are identical to those of a previous study. The ancestral composition (best K = 3) and bootstrap values are indicated. (B) Population structure analysis based on the nuclear genomic dataset. The ancestral composition (best K = 4) is presented. (C) Estimation of demography from nuclear genomes from six populations. The numbers of generations are indicated on the x-axis. The effective population size is indicated on the y-axis. (D) Comparison of the divergence statistic (Dxy) from the wild population and domesticated populations based on the nuclear and mitochondrial genomic datasets. The domesticated and wild groups were classified based on mitochondrial genomic datasets. (E) Ratio of genetic diversity (πdomesticated/πwild) for mandarin. (F) Evaluation of genetic load in mitochondrial genomes between wild and domesticated groups.

