Fig. 6.
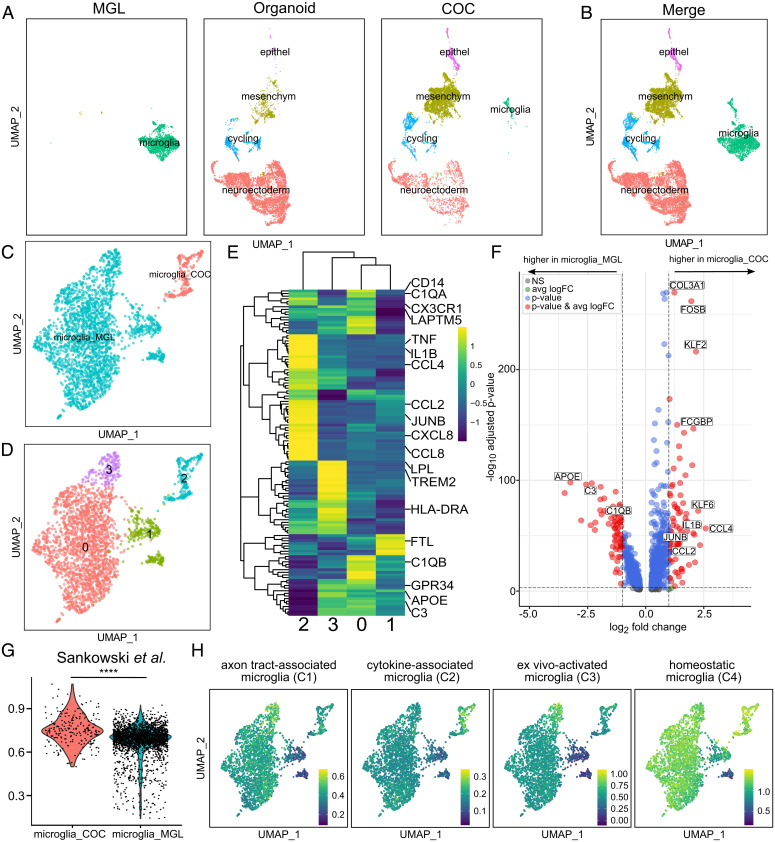
The single-cell MGL transcriptome changes in a complex cellular environment. (A and B) UMAP plot of 14,951 single-cell transcriptomes from three conditions: 2D MGL monoculture (MGL), organoids without microglia (organoid), and organoids cocultured with MGLs (COC) split by condition (A) or merged (B). (C) UMAP plot of 2,652 single-cell transcriptomes. MGLs in monoculture (microglia_MGL) compared with MGLs that were cocultured with organoids (microglia_COC). (D) UMAP plot of the same 2,652 single-cell transcriptomes, including microglia_MGL subclustering (clusters 0, 1, and 3) and microglia_COC (cluster 2). (E) Heatmap showing expression of a set of differentially expressed (DE) genes of primary human microglia (Table S3 in Sankowski et al. (38)) in microglia_MGL subclusters and microglia_COC (as defined in D). The values were scaled column-wise. (F) Volcano plot showing DE genes in microglia_MGL versus microglia_COC (as defined in C). The thresholds were set to a log2 fold change of 1 and a negative log10 P value of 3. Selected genes are labeled. The complete list of DE genes can be found in Dataset S2. (G) Violin plot displaying the global gene-set scores of microglia_COC (red) versus microglia_MGL (blue). The module scores were calculated from DE gene sets of primary human microglia (Table S3 in Sankowski et al. (38); the complete gene lists can be found in Dataset S3). P values were computed using the Wilcoxon rank sum test (****P ≤ 0.0001). (H) Feature plots depicting gene-set scores of the different microglia clusters based on previously defined clusters of microglia (51).

