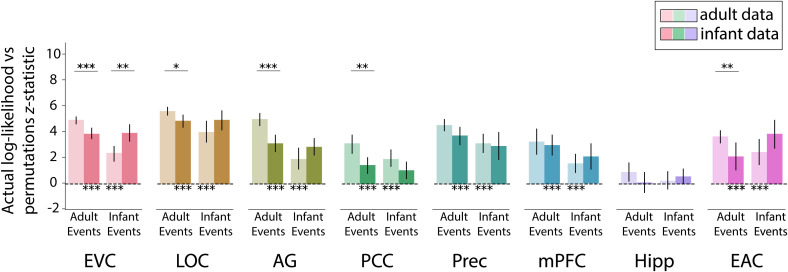
Fig. 4.
Reliability of event structure for models learned on participants of the same vs. other age group. Light bars indicate fit of adult and infant event structures to adult data, and dark bars indicate fit of adult and infant event structures to infant data. Note that the fits to the same group (adult events in adults, infant events in infants) are simply replotted from Fig. 3, without duplicating the statistics. Overall, event structures learned from adults and infants fit data from the other group (clearest in EVC and LOC). However, in several regions, these fits were weaker than to data from the same group (clearest in EVC, LOC, AG, PCC, and EAC for adult events and in EVC for infant events). Error bars represent 95% CIs of the mean from bootstrap resampling. ***P < 0.001, **P < 0.01, *P < 0.05.

