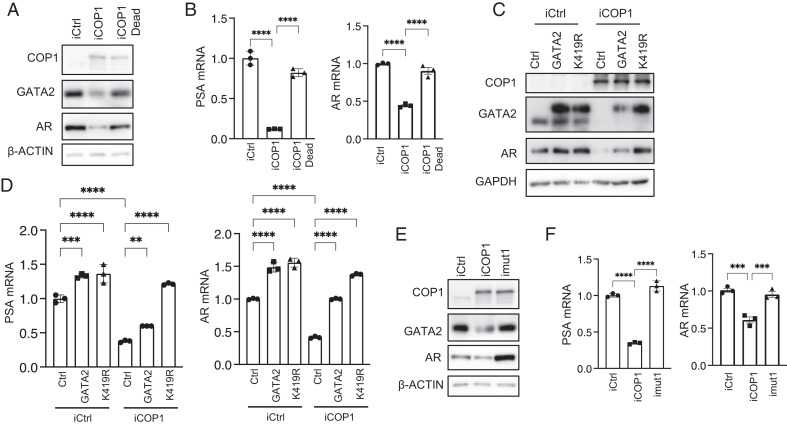
Fig. 6.
The COP1-GATA2 axis represses AR expression and activation in PCa cells. (A) Western blot and (B) qPCR assays on AR expression and activation (PSA expression) in the 0.5 µg/mL Dox-induced LNCaP cells expressing COP1 (iCOP1) versus the E3 ligase-dead COP1C136/139A mutant (iCOP1 dead) versus control (iCtrl). (C) Western blot and (D) qPCR assays on 0.5 µg/mL Dox-induced LNCaP cells expressing COP1 (iCOP1) versus control (iCtrl). These cells also overexpressed GATA2 versus GATA2K419R mutant (K419R) versus control (Ctrl). (E) Western blot and (F) qPCR assays on 0.5 µg/mL Dox-induced LNCaP cells expressing control (iCtrl), COP1 (iCOP1), or COP1mut1 with mutated first D/E-enriched motif as shown in Fig. 4A (imut1). Quantification data as means ± SD. **P < 0.01, ***P < 0.001, ****P < 0.0001. Data are representative of at least three independent experiments.

