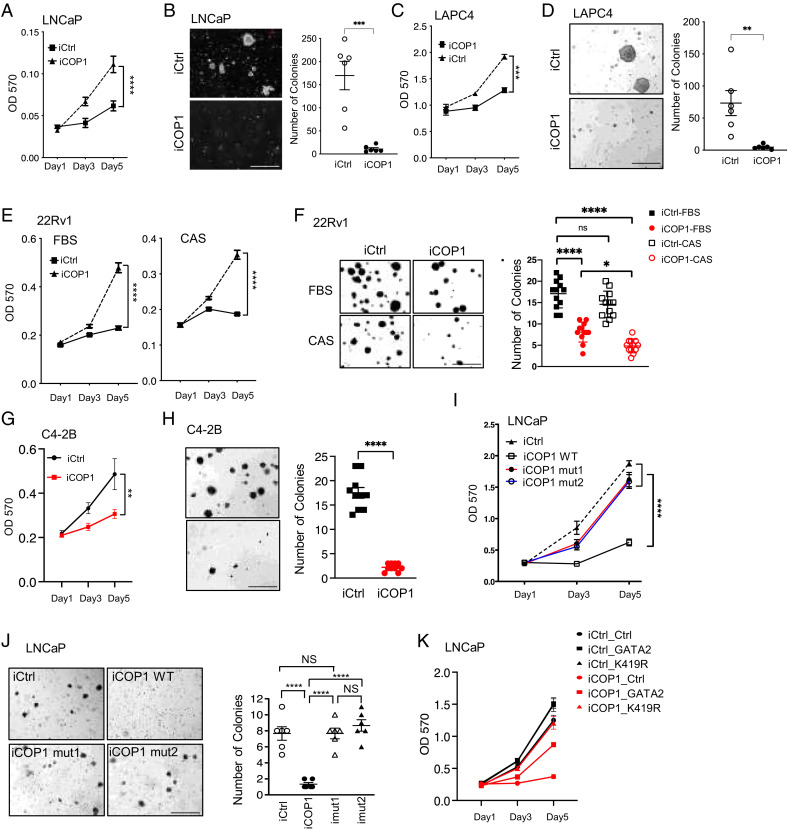
Fig. 7.
COP1 inhibits PCa and CRPC growth. (A, C) Cell proliferation and (B, D) soft-agar assays for 0.5 µg/mL Dox-induced LNCaP-iCOP1 versus LNCaP-iCtrl and LAPC4-iCOP1 versus LAPC4-iCtrl cells. (E) Proliferation and (F) soft-agar assays for 0.5 µg/mL Dox-induced 22Rv1-iCOP1 versus 22Rv1-iCtrl cultured in regular culture condition (10% FBS) versus complete castration condition (CAS:10 µm enzalutamide and 5% charcoal-stripped serum (CSS)). (G) Proliferation and (H) soft-agar assays for 0.5 µg/mL Dox-induced C4-2B-iCOP1 versus C4-2B-iCtrl cells. (I) Proliferation and (J) soft-agar assays for LNCaP cells with 0.5 µg/mL Dox-induced expression of wild-type (WT) COP1 versus COP1 mutants (mut1, mut2) lacking affinity to GATA2. Colony numbers were also quantified. (K) Proliferation assays for LNCaP cells with 0.5 µg/mL Dox-induced expression of COP1 (iCOP1) versus control (iCtrl) that also express GATA2 versus GATA2K419R (K419R) versus control (Ctrl). Quantification data as means ± SEM. *P < 0.05; **P < 0.01, ***P < 0.001, ****P < 0.0001, ns, not significant; OD 570, optical density at 570 nm. (Scale bars: 500 µm.) Data are representative of at least three independent experiments.

