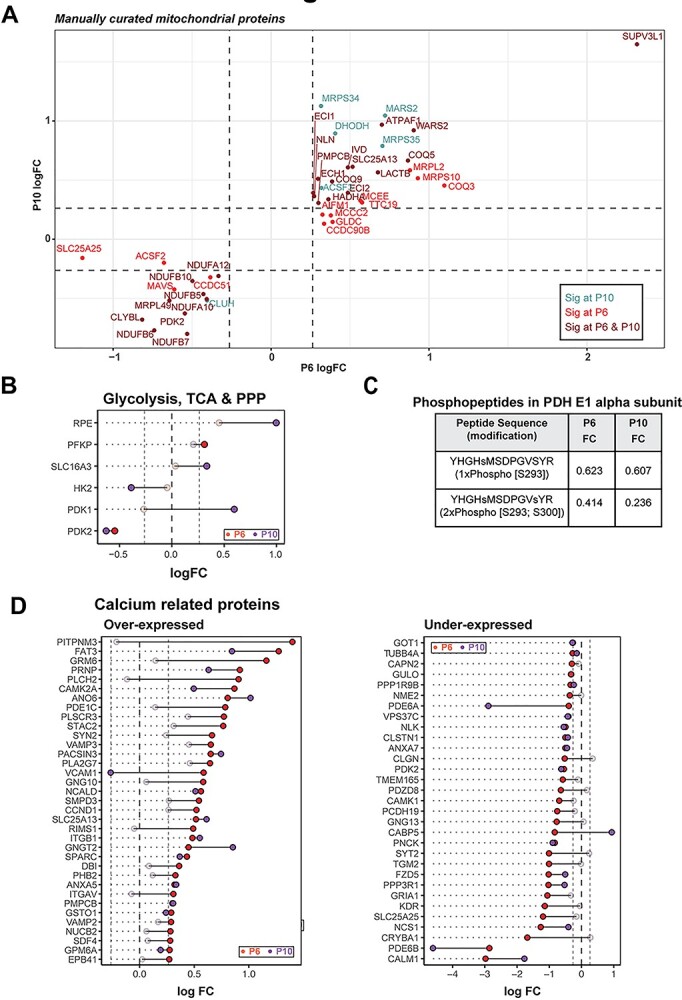
Figure 3.

rd1 retinas harbor abnormal abundance of mitochondrial and calcium-related proteins before degeneration. (A) Scatter plot of manually curated mitochondrial proteins show differential regulation of mitochondrial metabolic and signaling proteins at P6 and P10. Proteins with abundances significantly different at P6, P10 and both P6 and P10 are labeled in red, blue and brown, respectively. (B) Dumb bell plot showing change in protein expression from P6 to P10 for significantly differential glycolysis, TCA and PPP proteins. Dark red and purple dots denote proteins above significance threshold at P6 and P10, respectively. Gray dots represent proteins with non-significant differential expression. (C) Phosphopeptides detected in pyruvate dehydrogenase (PDH) E1 alpha subunit. (D) Dumb bell plot showing change in protein expression from P6 to P10 for significantly differential calcium-related proteins. Plot on the left summarizes proteins overexpressed in the rd1 retina, whereas plot on the right depicts under-expressed proteins. Color codes are same as in Figure 3B.
