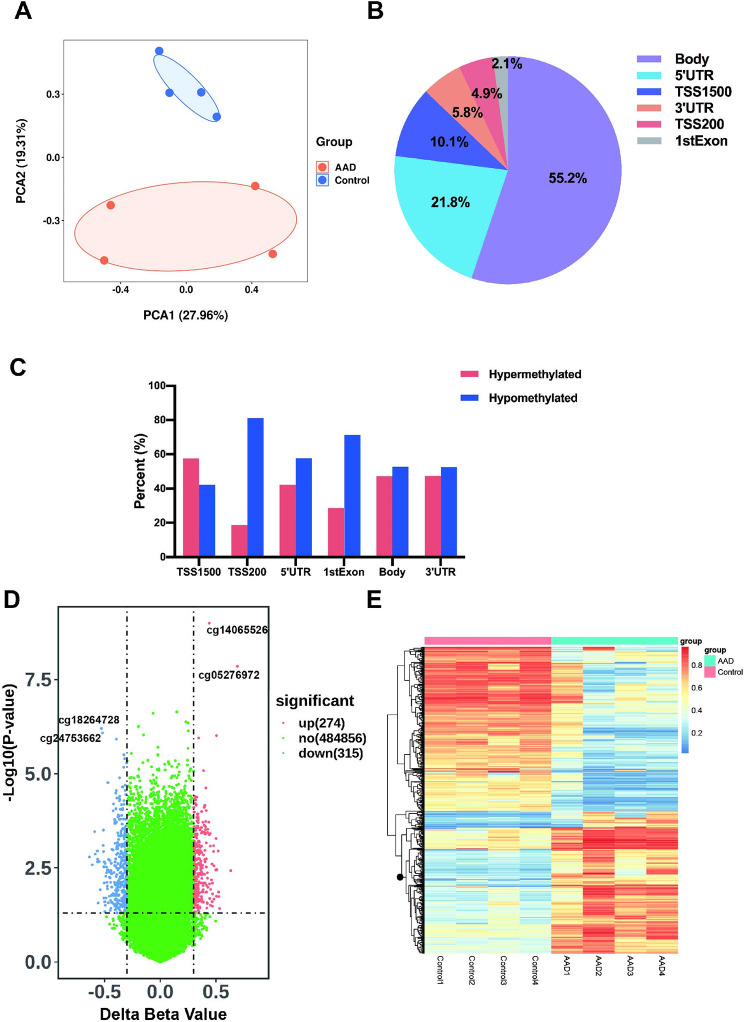
Fig. 1.
Visualization of the differential DNA methylation positions in aortic samples between Stanford-A acute aortic dissection and control group
(A) Principal component analysis showing the differences of DNA methylation between the two groups
(B) Percentages of differential DNA methylation in different genomic components
(C) Hypermethylation and hypomethylation in different genomic components
(D) Volcano plot presenting distribution and degree of the DNA methylation of the two groups. Red dots are the significantly hypermethylated positions and the blue dots are the significantly hypomethylated positions. The green dots are the positions with no significant difference. The top two significant hypermethylated and hypomethylated positions were labeled
(E) Heat map showing different features of DNA methylation profile between the two groups

