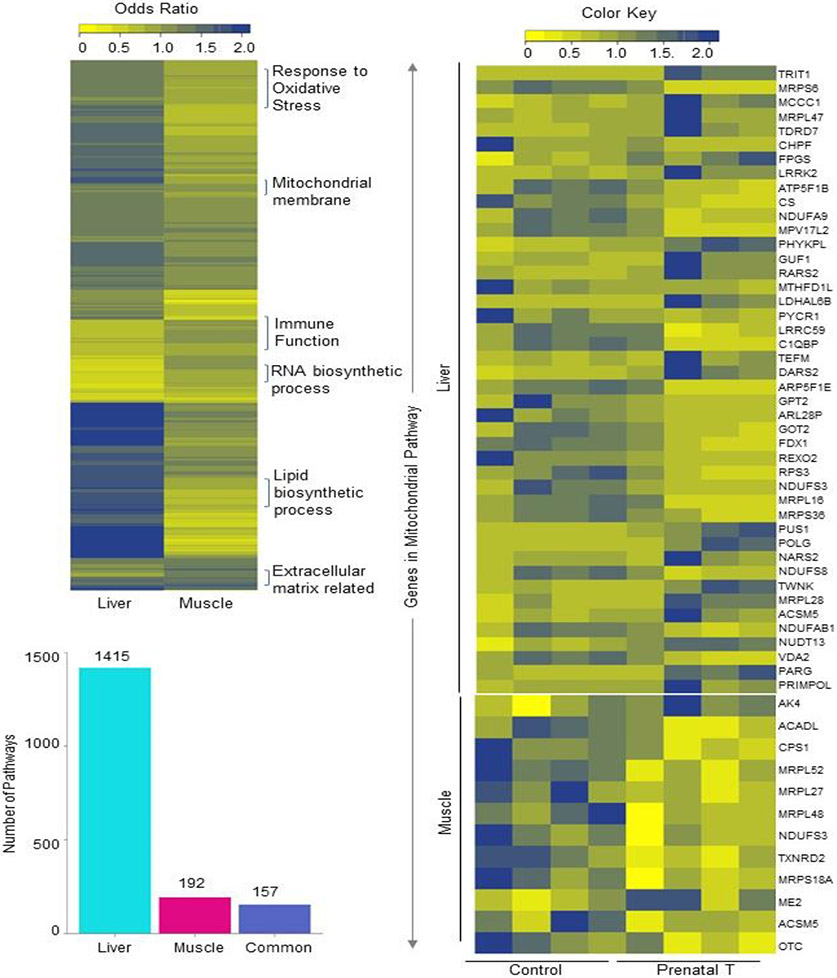
Fig. 3. Enrichment of gene pathways in liver and muscle and expression levels of genes in commonly dysregulated pathways by prenatal BPA-treatment.
Heat map (top left) represents the differentially regulated gene pathways in liver and muscle from prenatal BPA-treated animals enriched at FDR < 0.01. The bar plots (bottom-left) represent the number of gene pathways differentially modulated that are unique to liver and muscle. Heatmap (right) showing genes involved in the mitochondrial membrane pathway that is dysregulated in both liver (top) and muscle (bottom). The normalized counts of genes in the mitochondrial gene pathway in control and prenatal BPA-treated animals are plotted along a gradient of colors, with blue representing highest and yellow the lowest.

