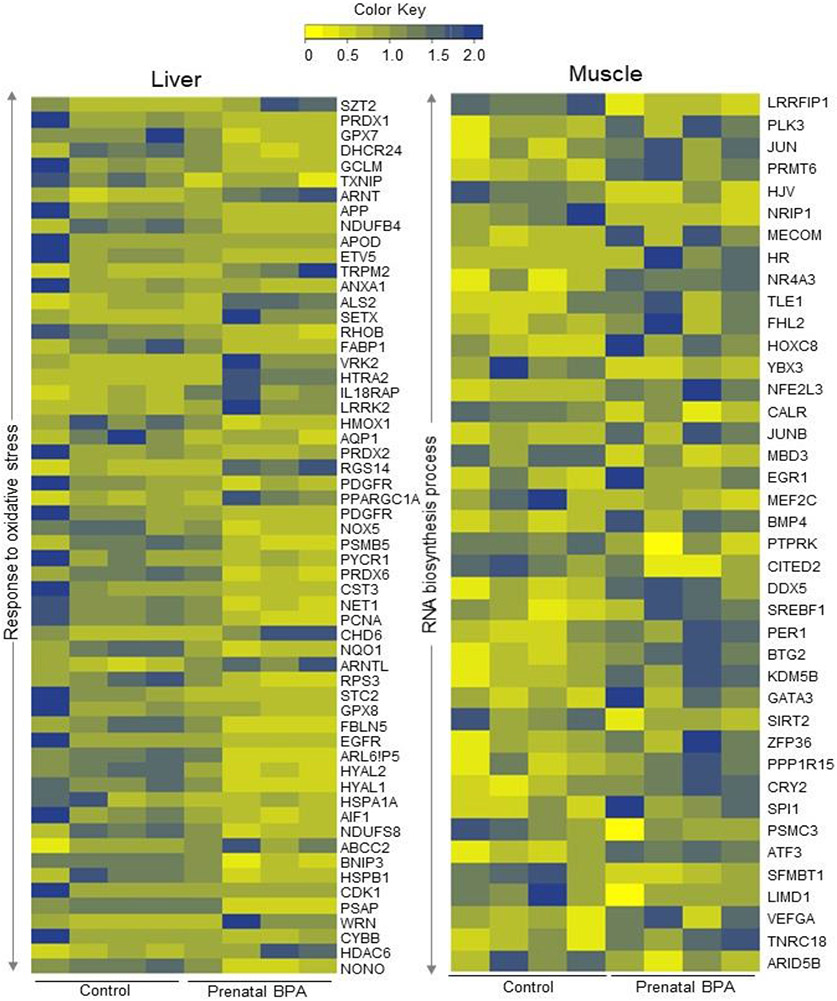
Fig. 4. Genes in dysregulated pathways enriched in tissue-specific manner in either liver or muscle:
Heatmap showing genes involved in response to oxidative stress in the liver (left) and RNA biosynthetic process in the muscle (right) that are dysregulated by prenatal BPA-treatment at FDR < 0.01. The normalized counts of genes in the respective pathways in each tissue from control and prenatal BPA-treated animals are represented as a gradient of colors with blue representing the highest and yellow representing the lowest.

