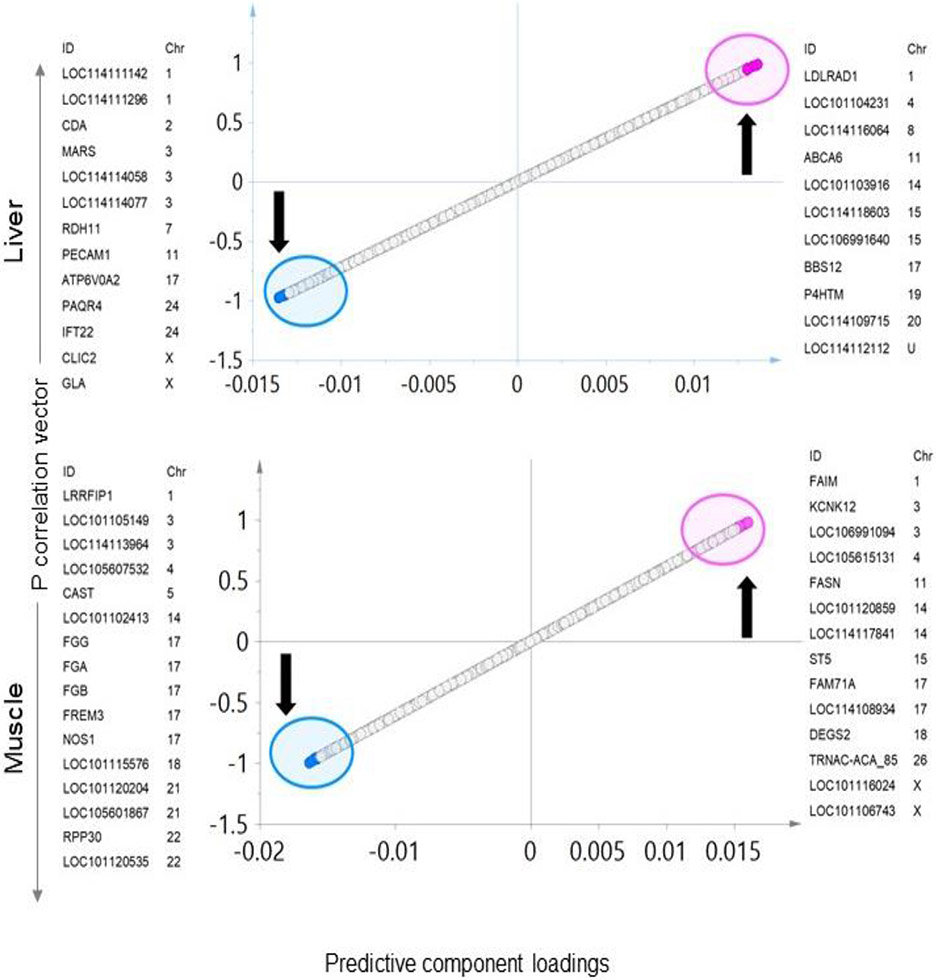
Fig. 5. Liver or muscle specific transcriptome signatures of prenatal BPA-treatment:
Total RNA, OPLS-DA S- Plots from liver (top) and muscle (bottom) showing potential coding signatures of BPA-treatment. The up and down arrow represents the upregulated and downregulated genes with prenatal BPA -treatment, respectively. Each point represents a coding RNA with pink and blue points representing the potential signatures of prenatal BPA-treatment that are up and downregulated, respectively.

