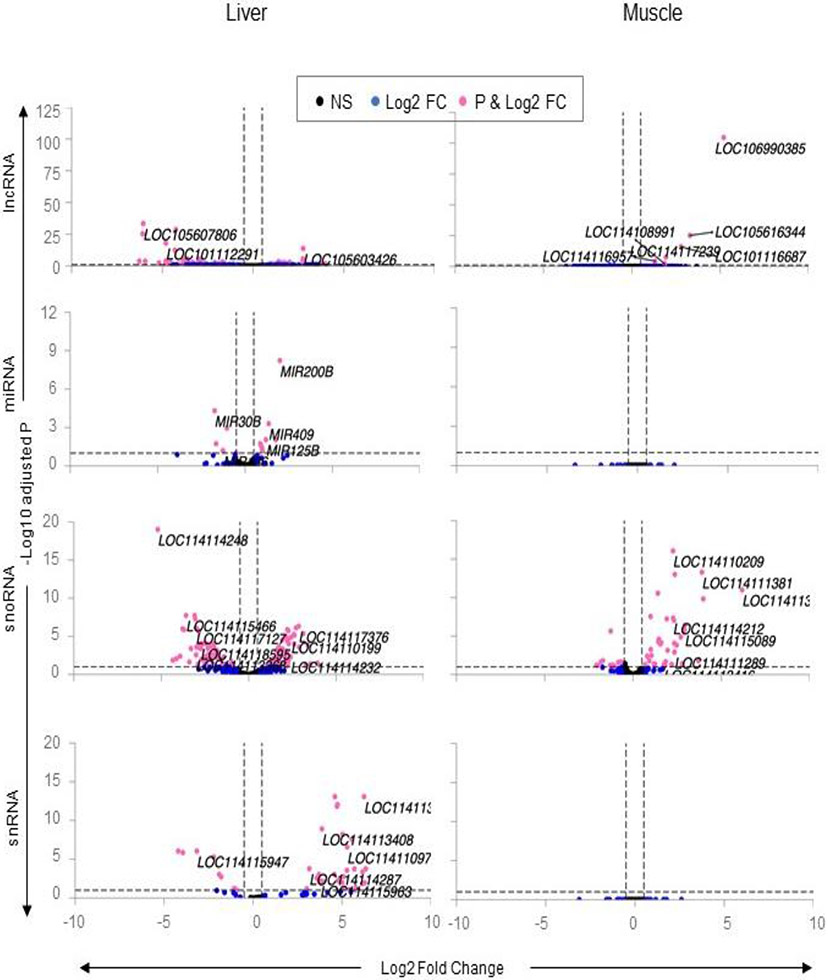
Fig. 7. Differential expression of non-coding RNA in liver and muscle from prenatal BPA-treated Animals.
The Volcano plot, plotted by log2 fold change in the X-axis and -log10 p-adjusted values in the Y-axis, shows prenatal BPA induced differential gene expression in the liver and muscle. Pink points denote the genes that have absolute log2 foldchange > 0.5 and p-adjusted values < 0.05. Black dots represent genes that did not meet p-adjusted cut-off of < 0.05 and absolute log2 fold change > 0.5, and blue dots represent genes which met meet the absolute log2 fold change > 0.5 but did not meet p-adjusted cut-off of < 0.05.

