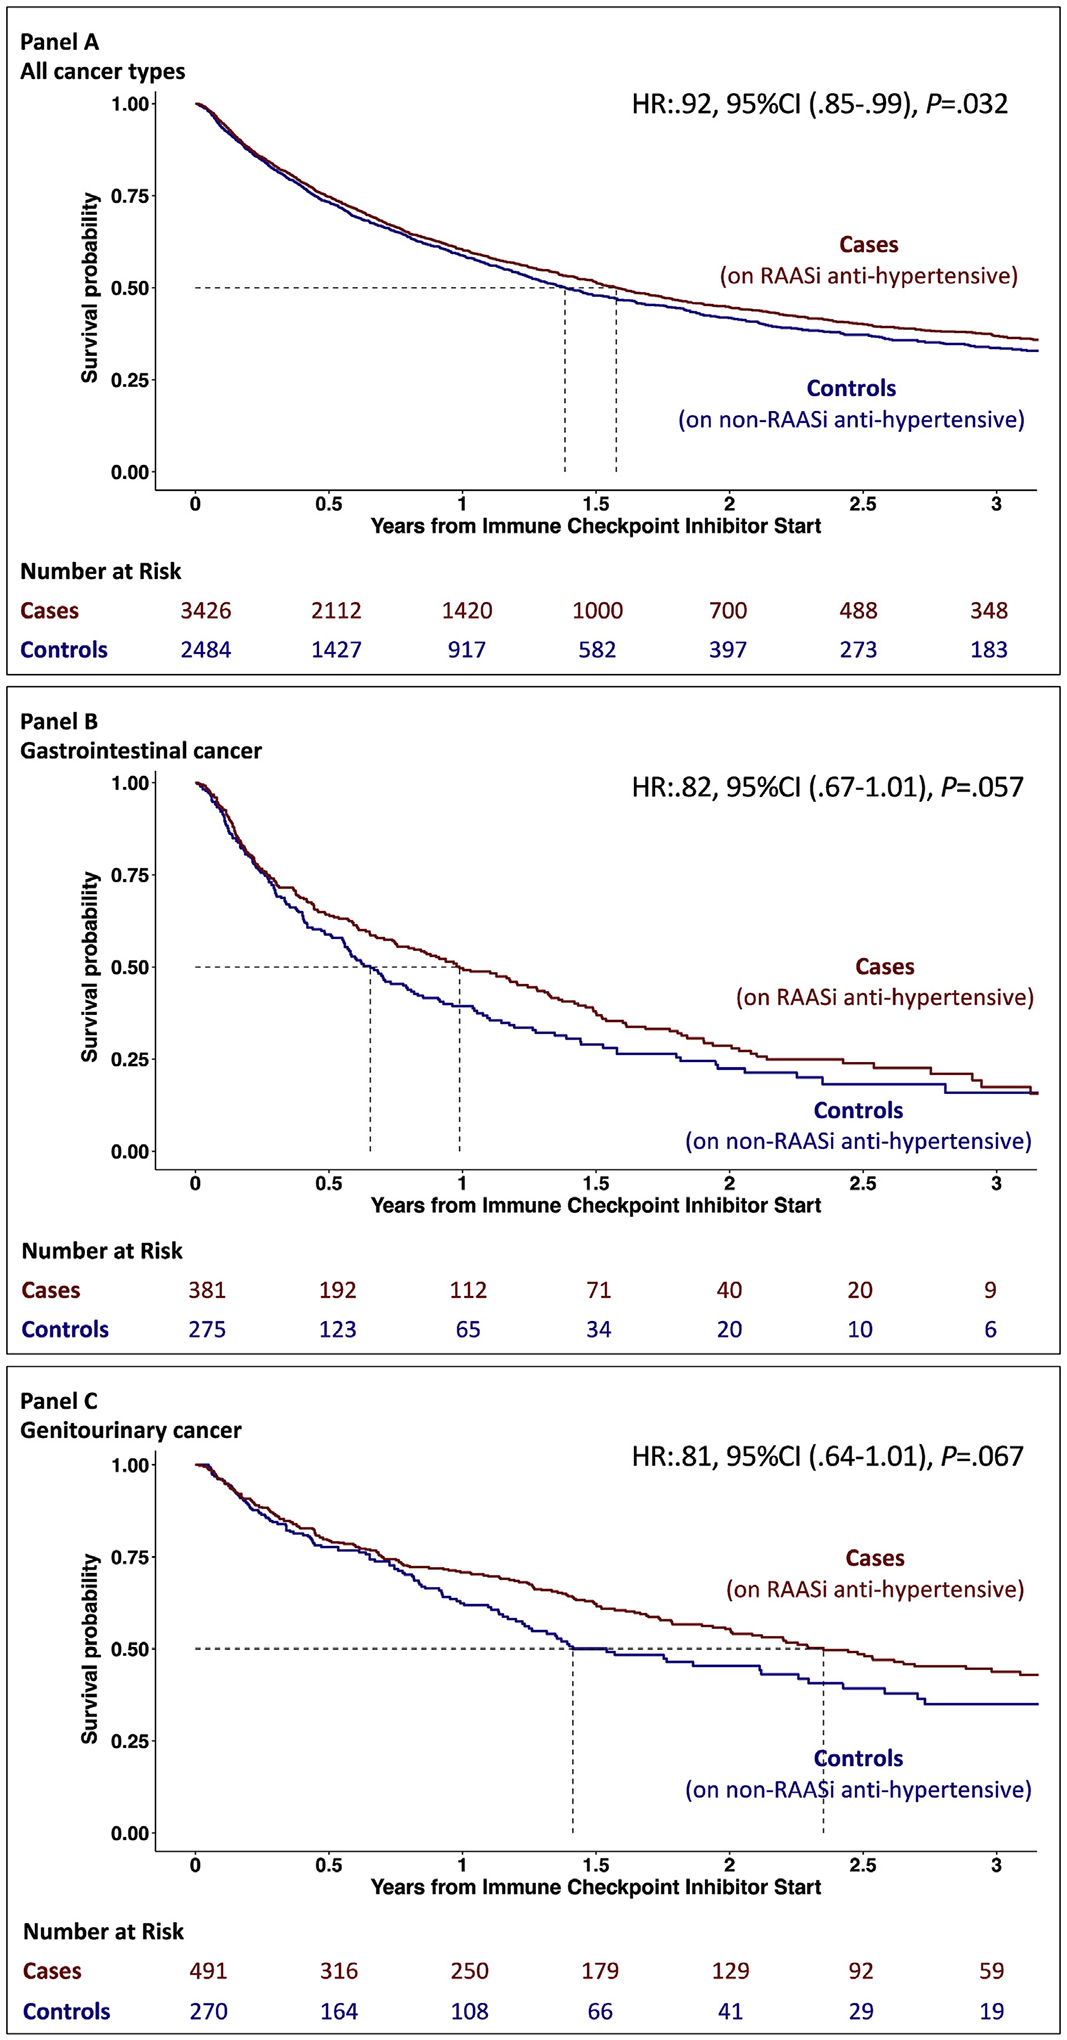
Fig. 2. Kaplan–Meier curves of the survival probability over time after starting immune checkpoint inhibitor therapy.

Panel A shows the cumulative hazard for overall survival. Cases (patients treated with RAAS inhibitors for hypertension) are marked with red, and controls (patients treated with non–RAAS inhibitors for hypertension) are marked with blue. Panel B shows the subgroup of patients with gastrointestinal cancer, and Panel C shows patients with genitourinary cancer.
